Stock Price Chart Gallery
Quickly review stock charts for stocks that comprise the S&P 100.
Stocks are ordered from hightest to lowest on their one year percent change in price (12-month momentum).
Stock prices updated through market close on 04/12/2024
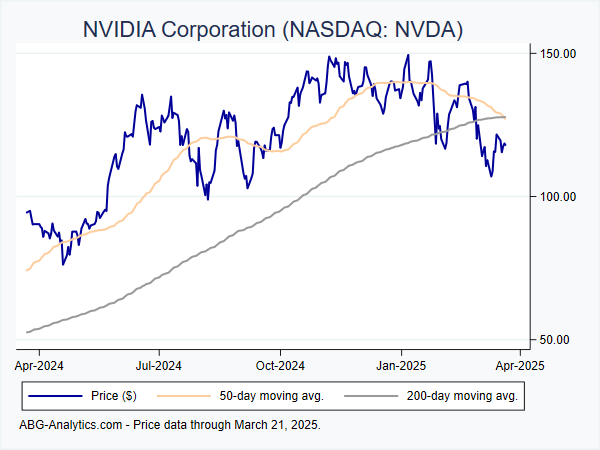
NVIDIA Corporation (NASDAQ:NVDA)
12-month return: 232.8%
12-month return: 232.8%
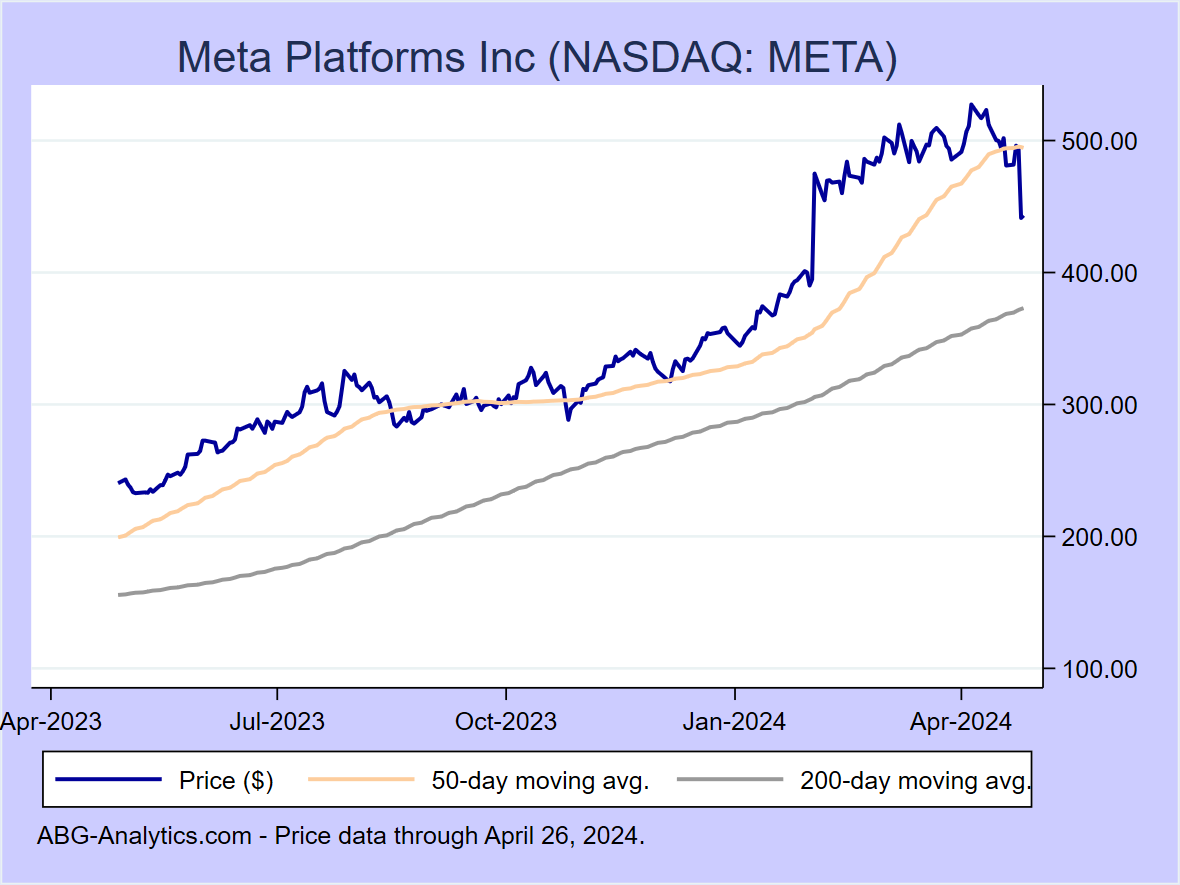
Meta Platforms Inc (NASDAQ:META)
12-month return: 139.2%
12-month return: 139.2%
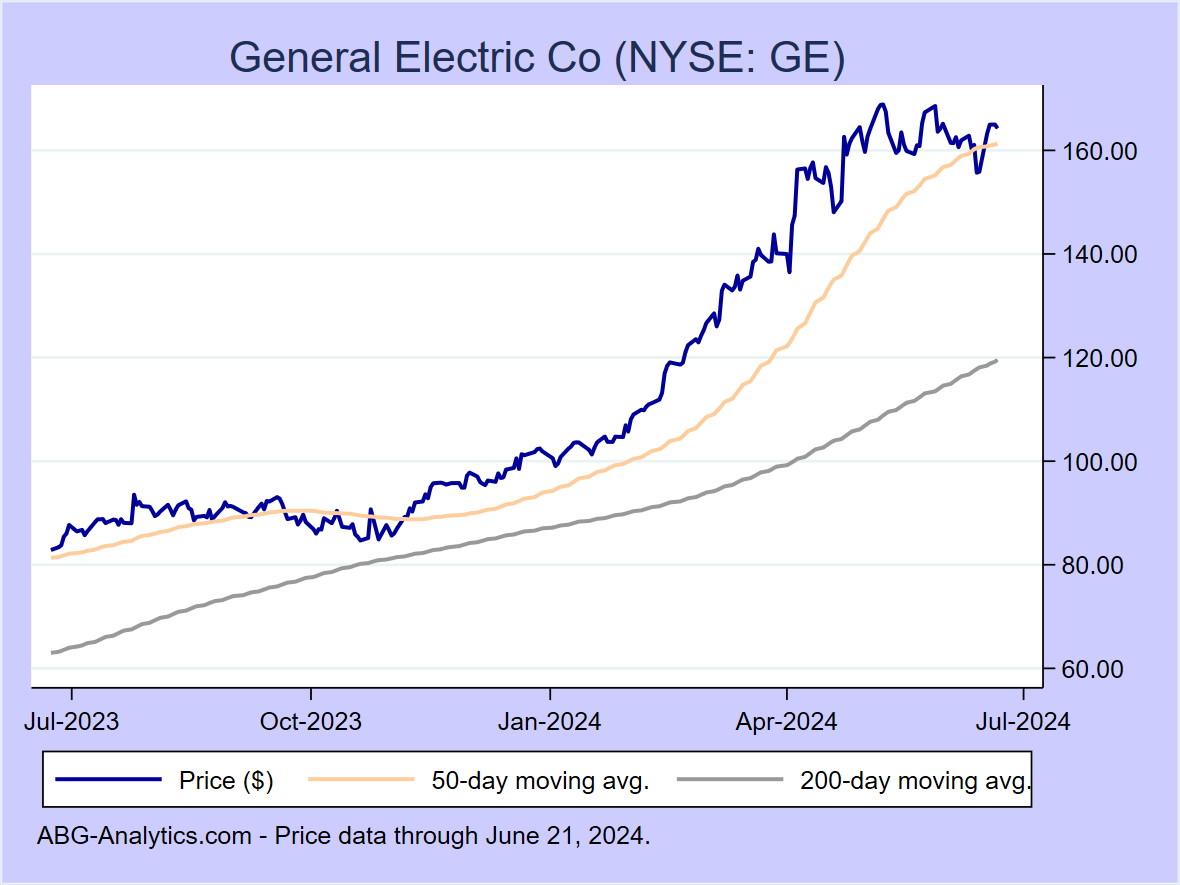
General Electric Co (NYSE:GE)
12-month return: 105.8%
12-month return: 105.8%

Eli Lilly & Company (NYSE:LLY)
12-month return: 103.7%
12-month return: 103.7%
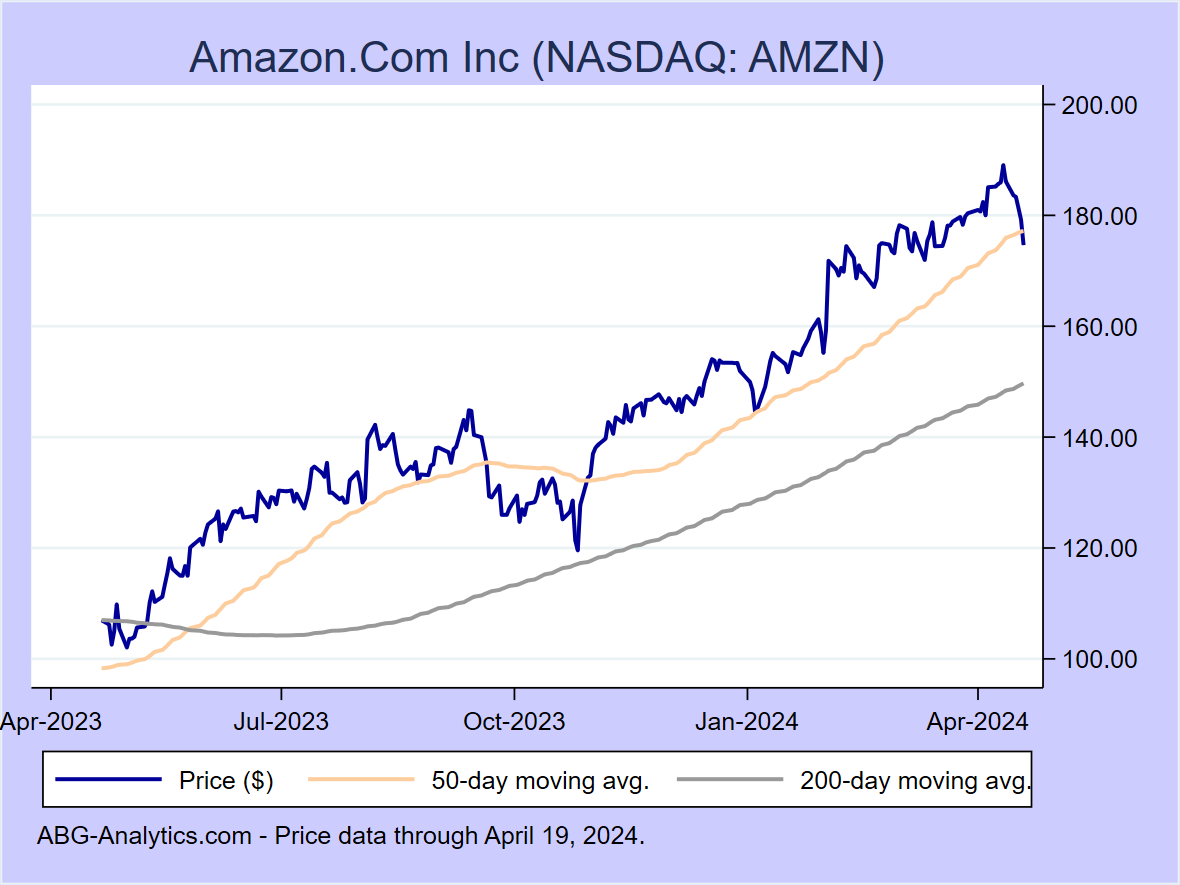
Amazon.Com Inc (NASDAQ:AMZN)
12-month return: 90.3%
12-month return: 90.3%
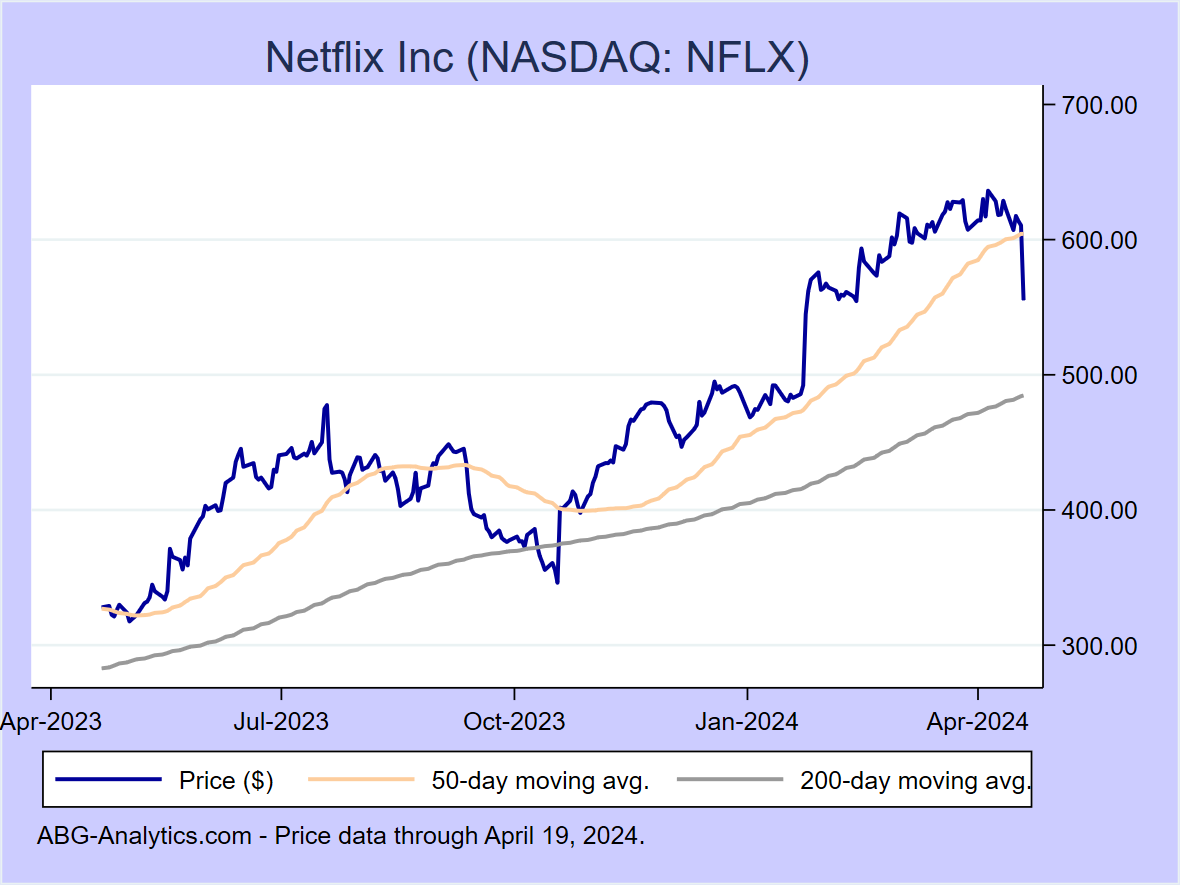
Netflix Inc (NASDAQ:NFLX)
12-month return: 88.1%
12-month return: 88.1%
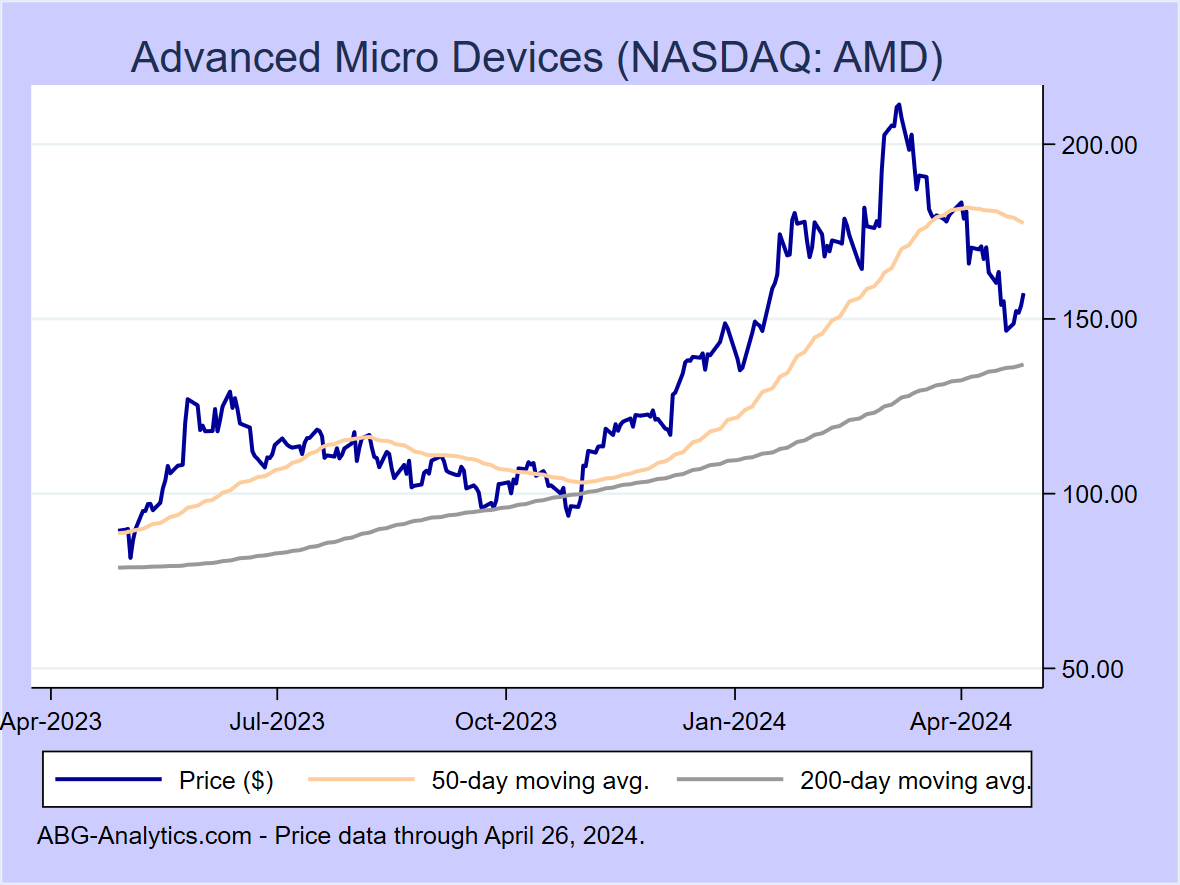
Advanced Micro Devices (NASDAQ:AMD)
12-month return: 76.8%
12-month return: 76.8%
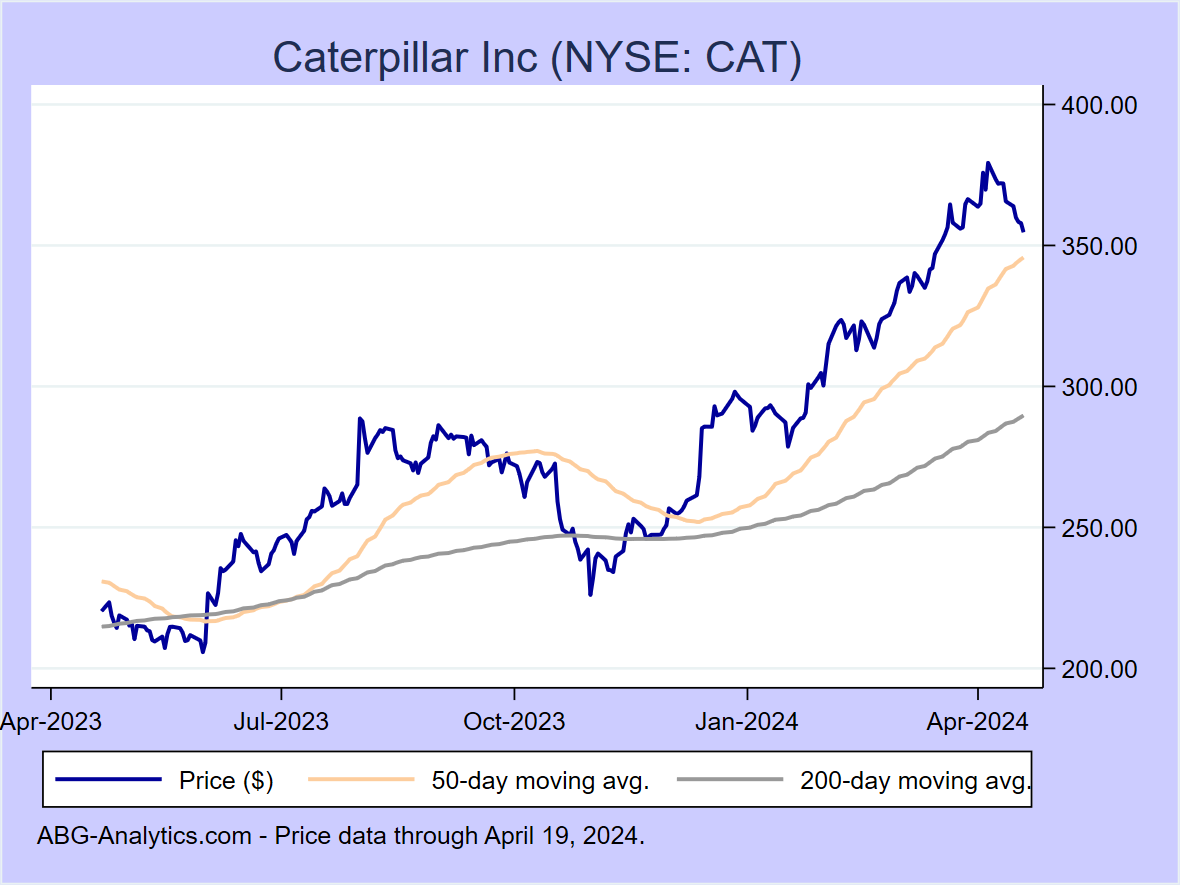
Caterpillar Inc (NYSE:CAT)
12-month return: 65.8%
12-month return: 65.8%
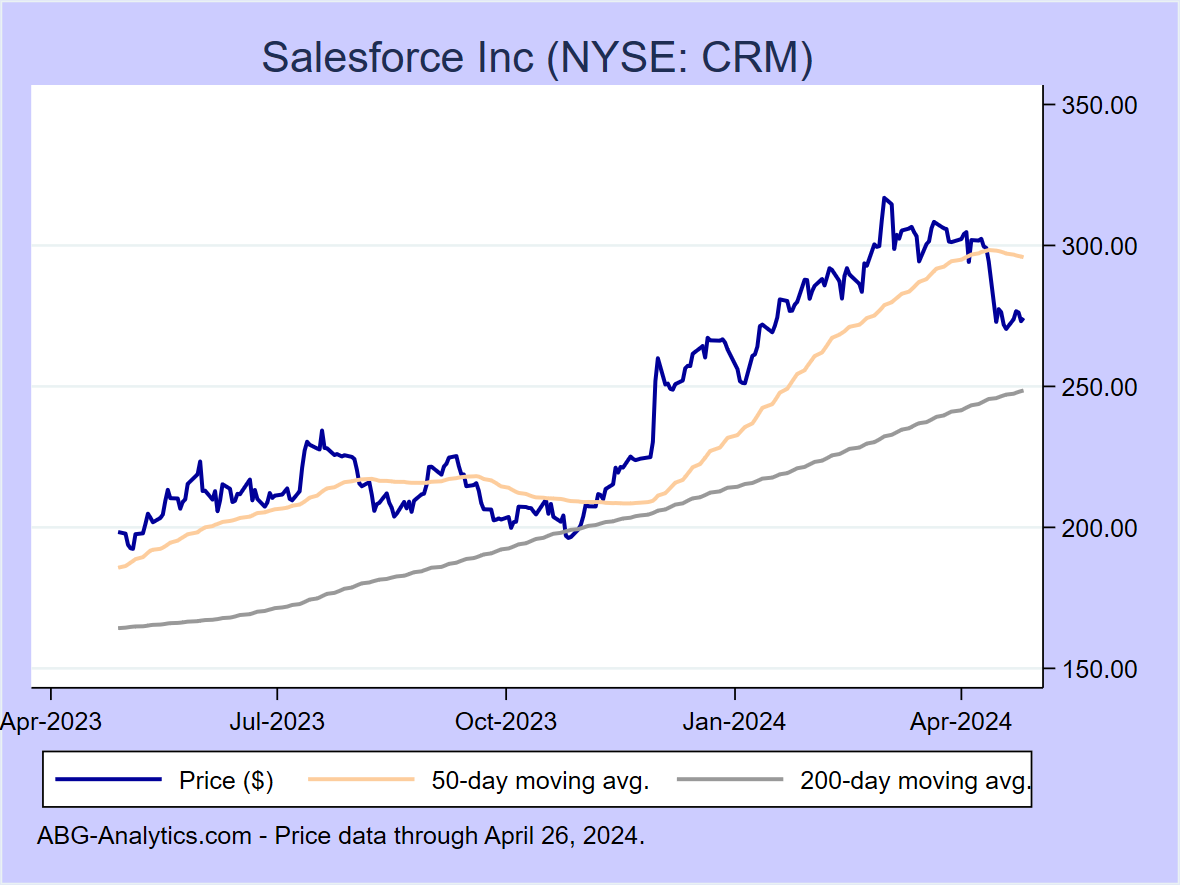
Salesforce Inc (NYSE:CRM)
12-month return: 54.6%
12-month return: 54.6%

Alphabet Inc (NASDAQ:GOOG)
12-month return: 51.3%
12-month return: 51.3%

Alphabet Inc Class A (NASDAQ:GOOGL)
12-month return: 50.7%
12-month return: 50.7%
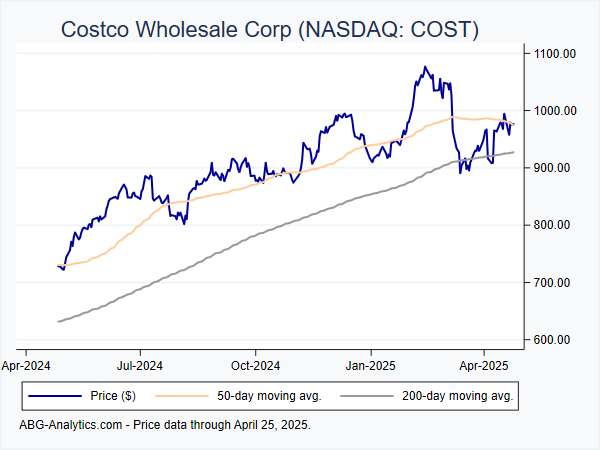
Costco Wholesale Corp (NASDAQ:COST)
12-month return: 49.4%
12-month return: 49.4%
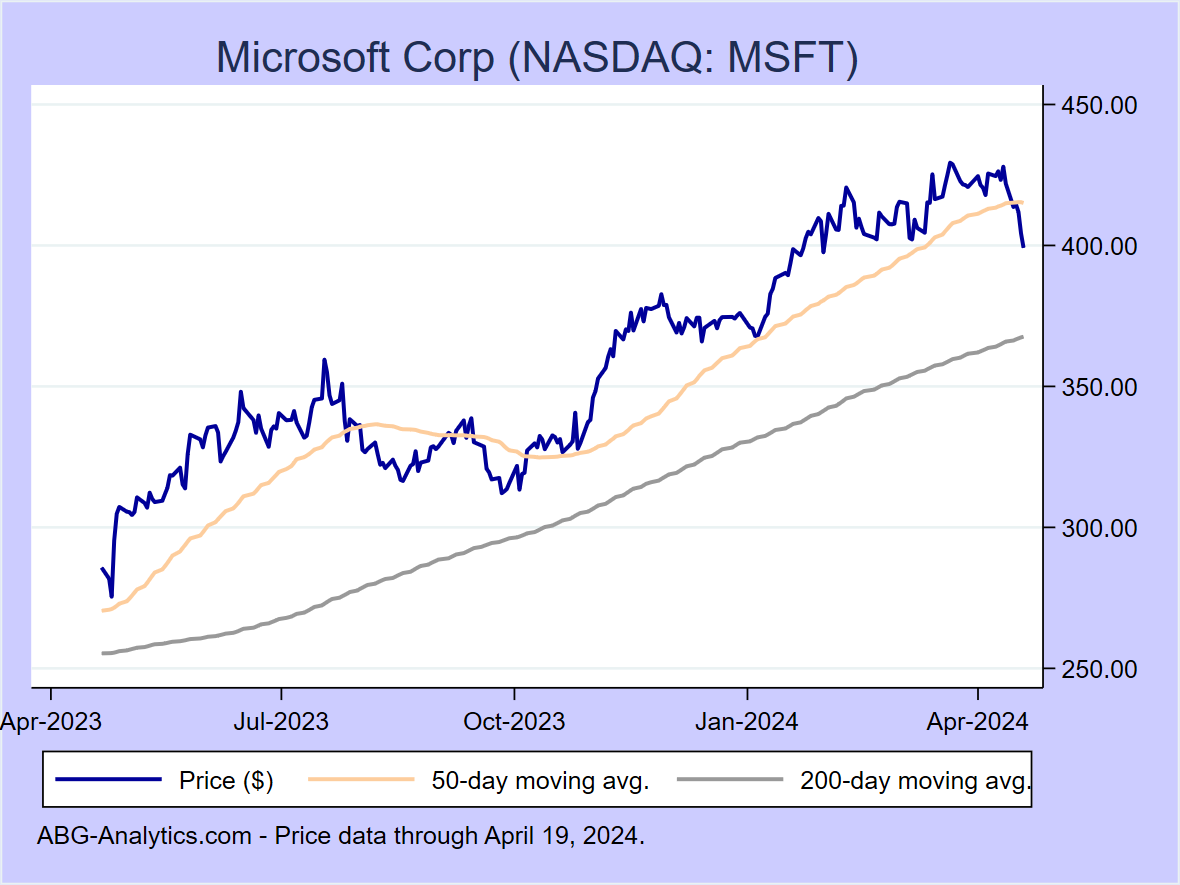
Microsoft Corp (NASDAQ:MSFT)
12-month return: 48.8%
12-month return: 48.8%
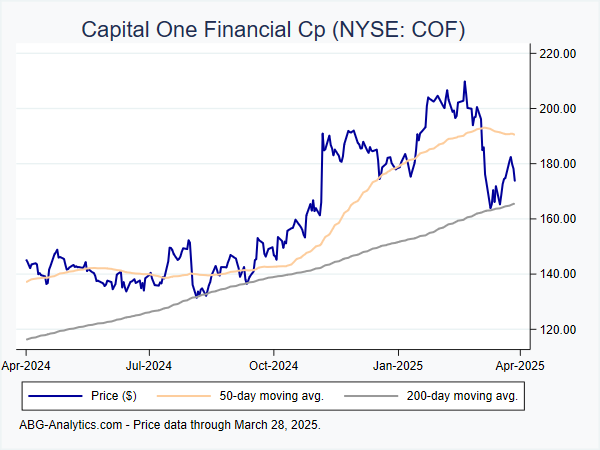
Capital One Financial Cp (NYSE:COF)
12-month return: 45.9%
12-month return: 45.9%
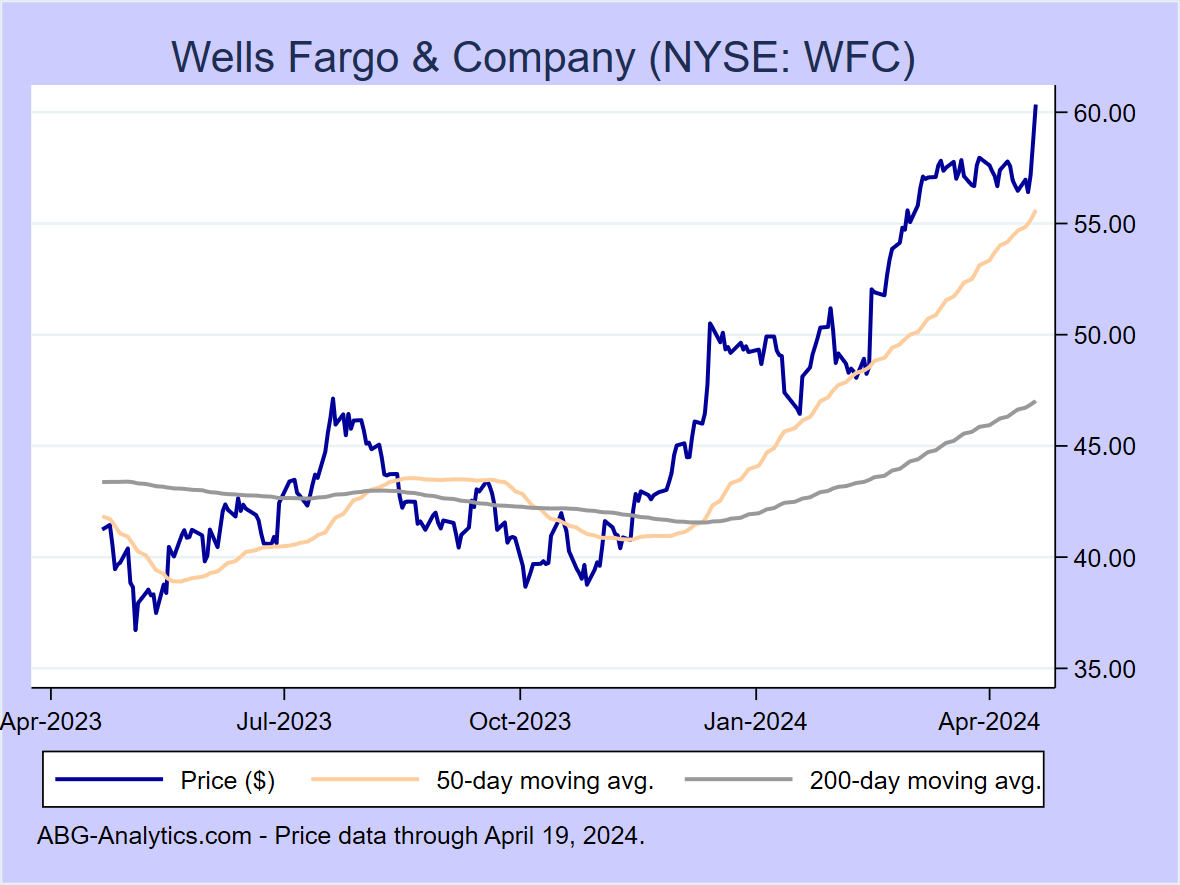
Wells Fargo & Company (NYSE:WFC)
12-month return: 44.1%
12-month return: 44.1%
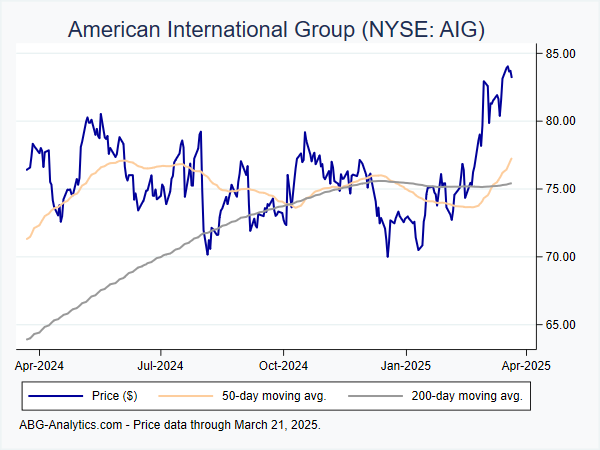
American International Group (NYSE:AIG)
12-month return: 43.6%
12-month return: 43.6%
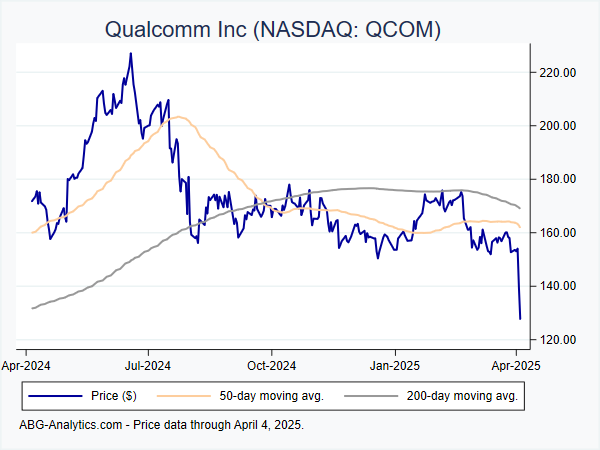
Qualcomm Inc (NASDAQ:QCOM)
12-month return: 42.4%
12-month return: 42.4%
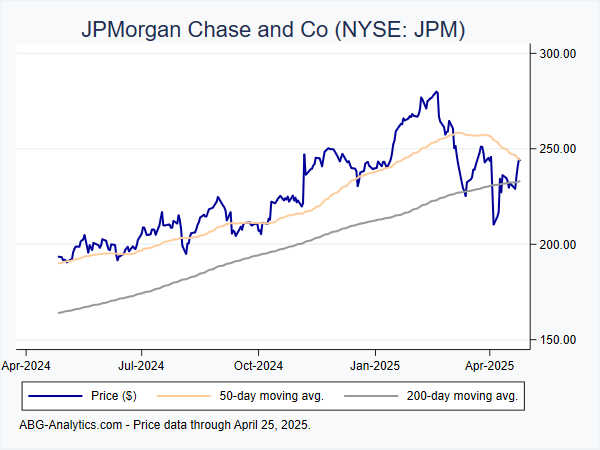
JPMorgan Chase and Co (NYSE:JPM)
12-month return: 42.2%
12-month return: 42.2%

International Business Machines Corp (NYSE:IBM)
12-month return: 41.8%
12-month return: 41.8%
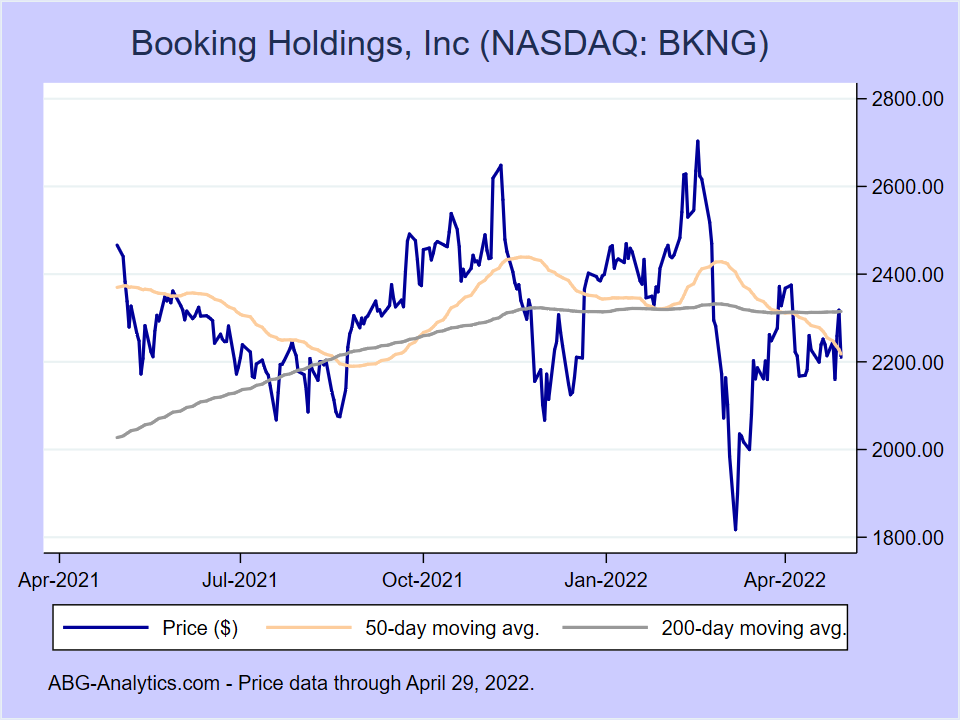
Booking Holdings Inc (NASDAQ:BKNG)
12-month return: 38.7%
12-month return: 38.7%
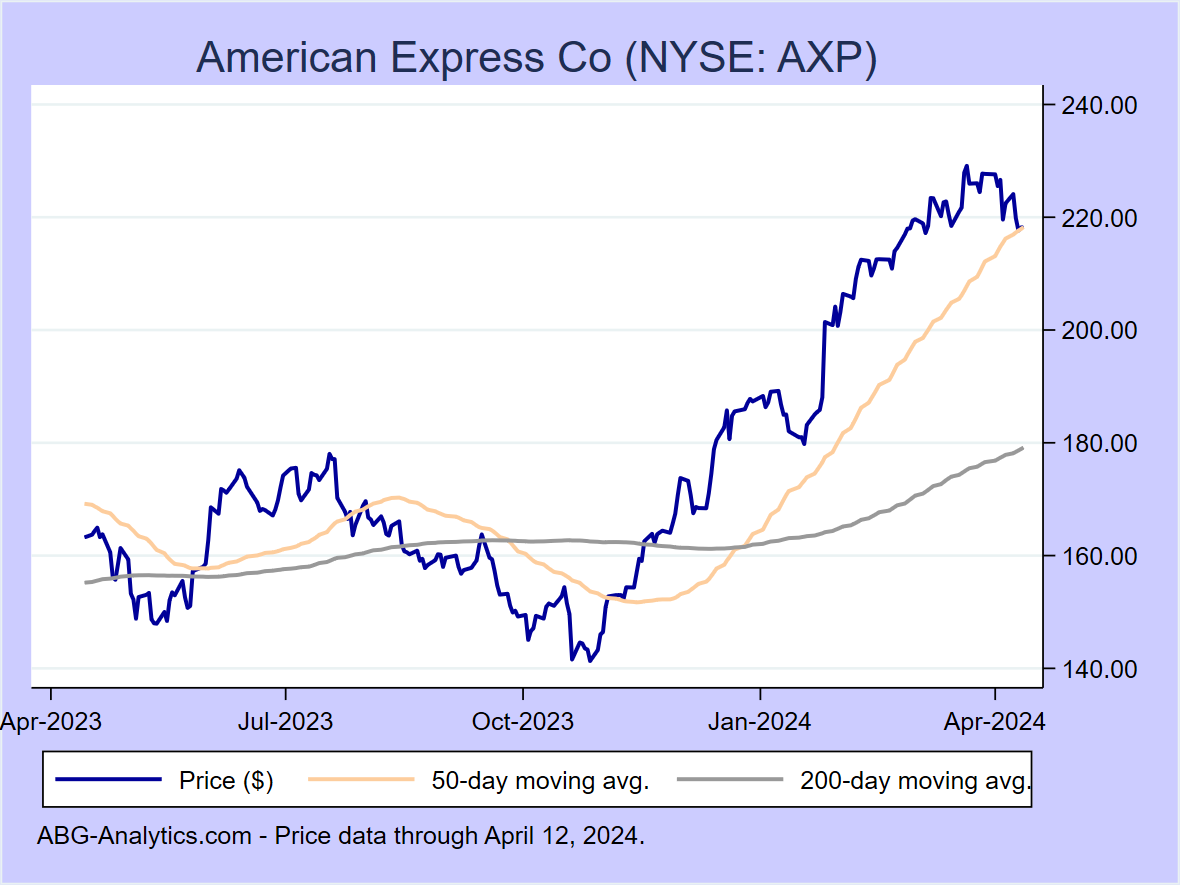
American Express Co (NYSE:AXP)
12-month return: 37.0%
12-month return: 37.0%
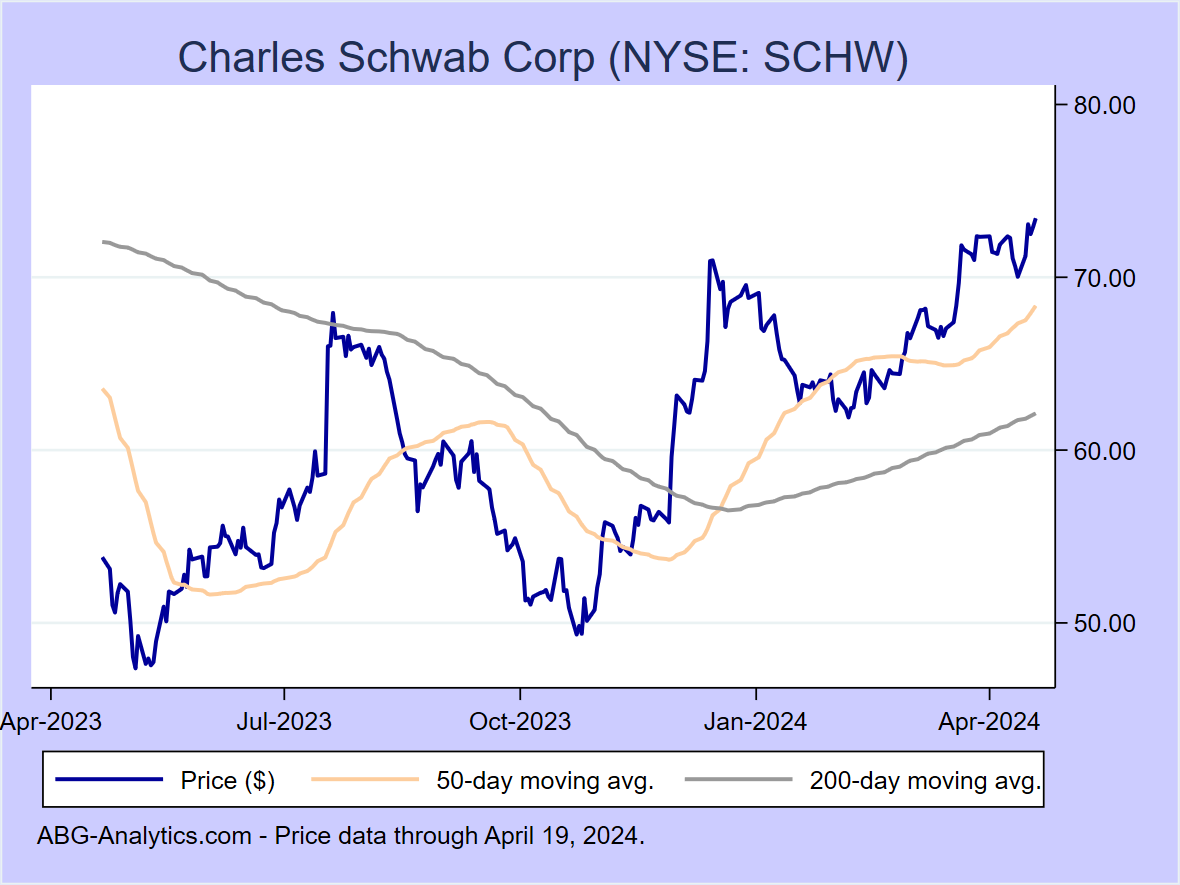
Charles Schwab Corp (NYSE:SCHW)
12-month return: 34.9%
12-month return: 34.9%
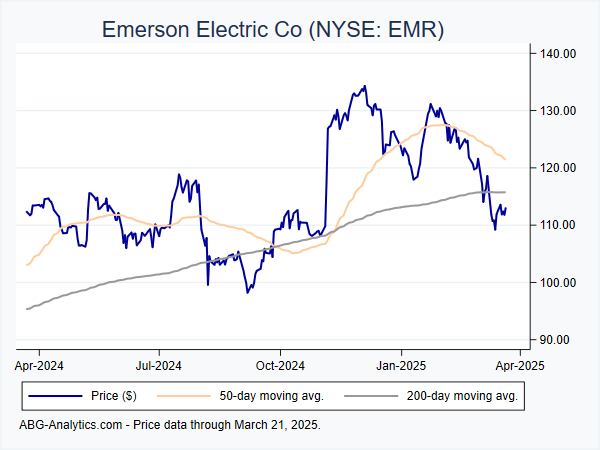
Emerson Electric Co (NYSE:EMR)
12-month return: 34.7%
12-month return: 34.7%
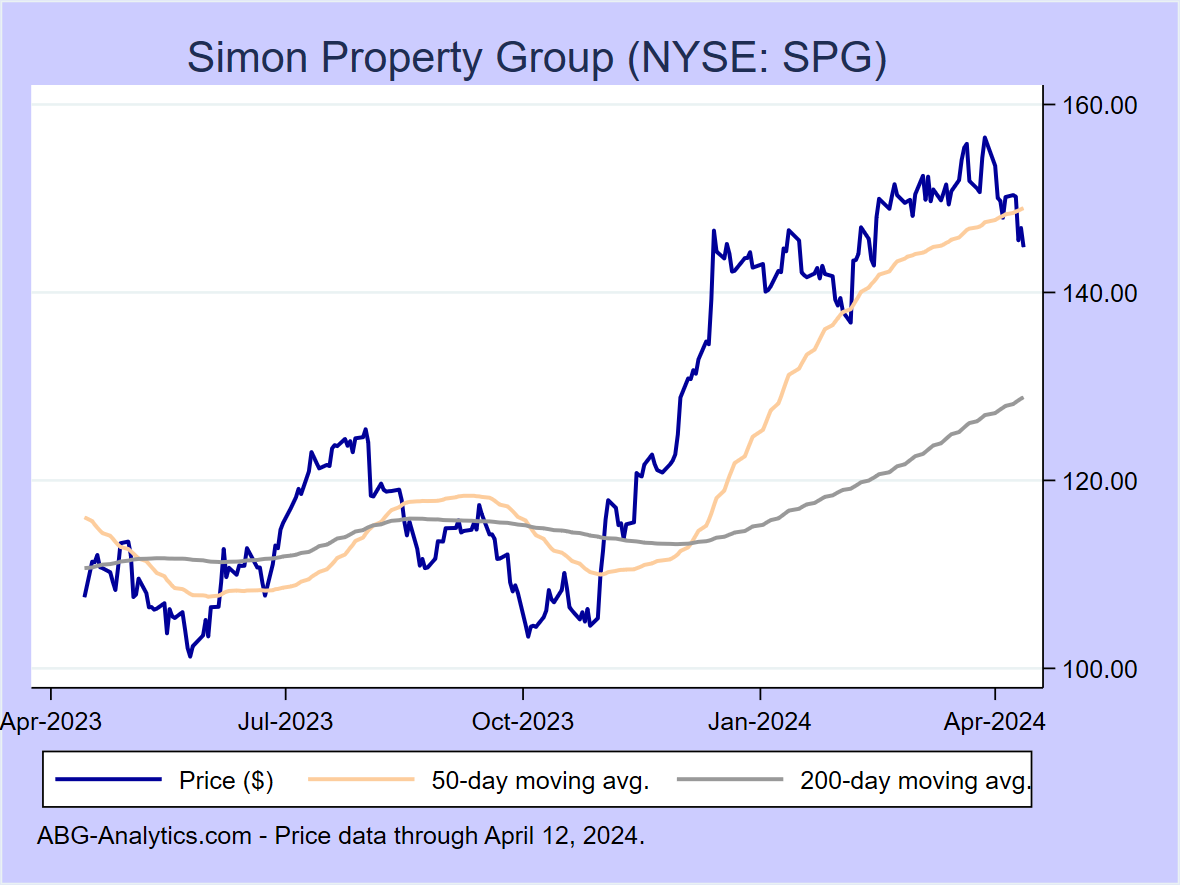
Simon Property Group (NYSE:SPG)
12-month return: 32.2%
12-month return: 32.2%
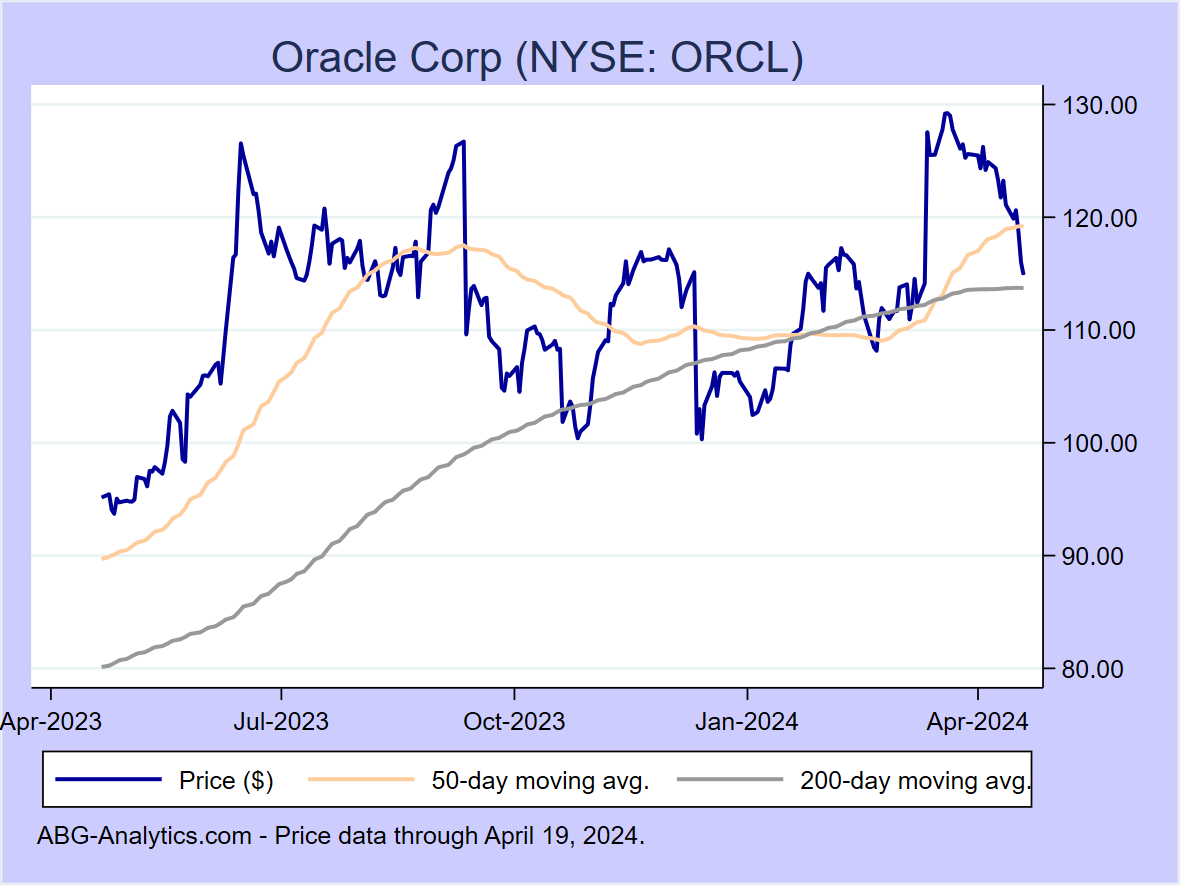
Oracle Corp (NYSE:ORCL)
12-month return: 29.0%
12-month return: 29.0%
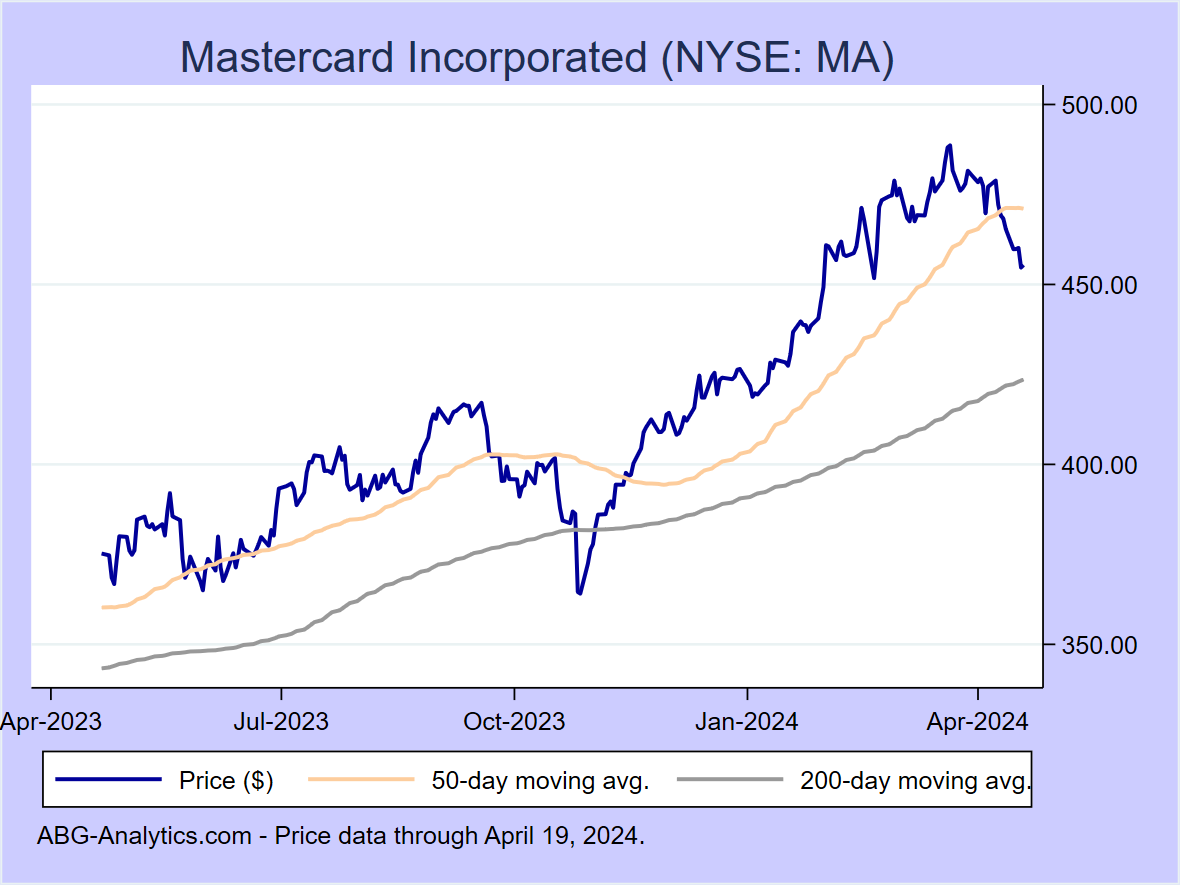
Mastercard Incorporated (NYSE:MA)
12-month return: 28.6%
12-month return: 28.6%
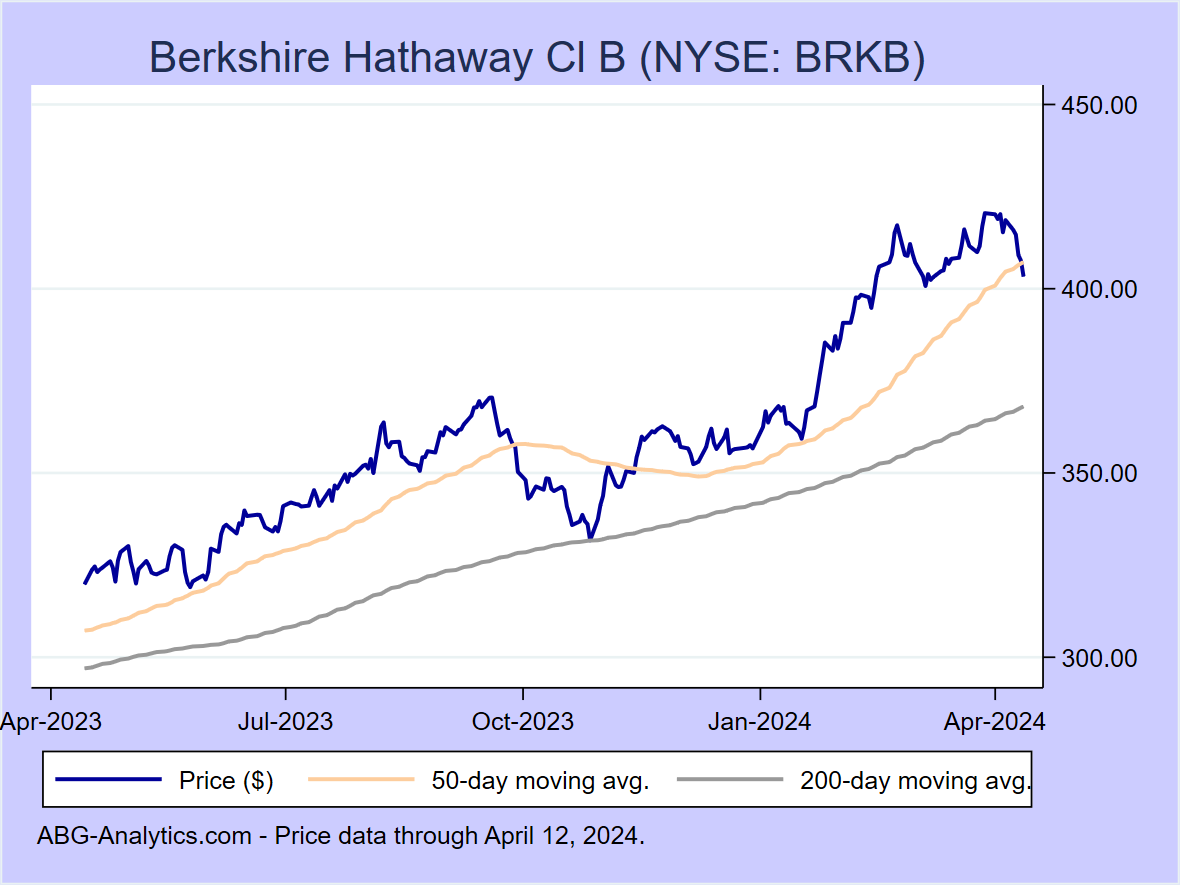
Berkshire Hathaway Cl B (NYSE:BRKB)
12-month return: 28.2%
12-month return: 28.2%
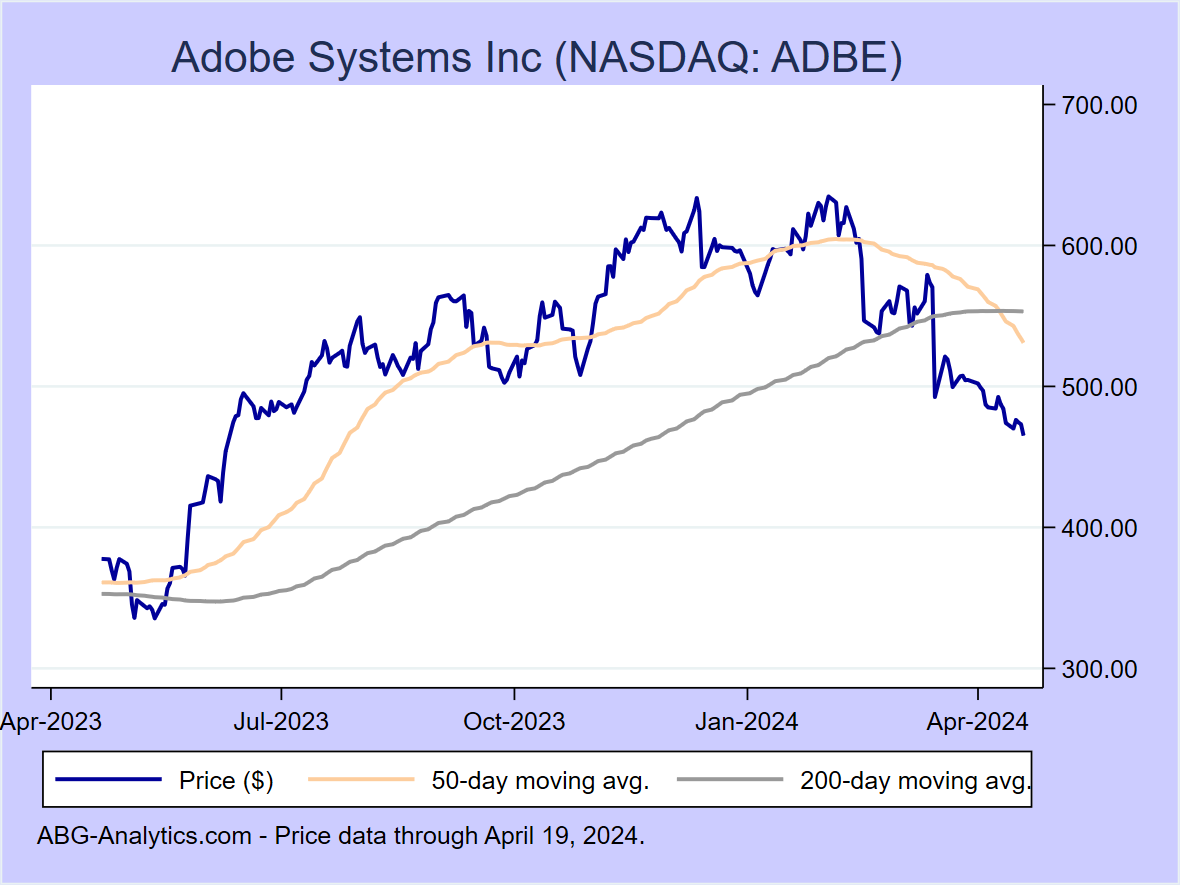
Adobe Systems Inc (NASDAQ:ADBE)
12-month return: 28.2%
12-month return: 28.2%
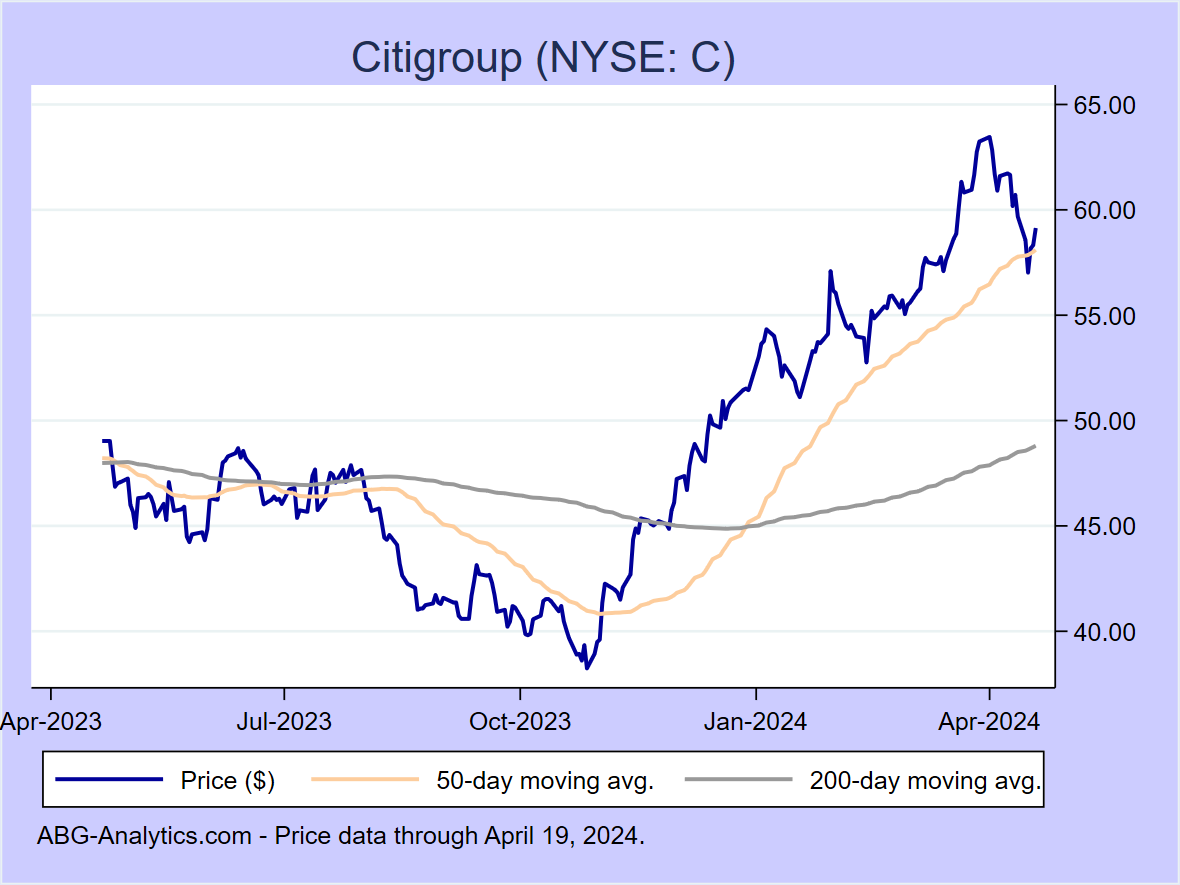
Citigroup (NYSE:C)
12-month return: 27.2%
12-month return: 27.2%
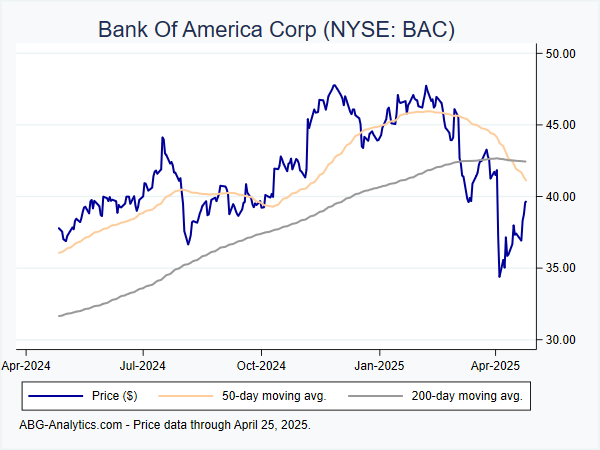
Bank Of America Corp (NYSE:BAC)
12-month return: 25.7%
12-month return: 25.7%

General Dynamics Corp (NYSE:GD)
12-month return: 25.6%
12-month return: 25.6%
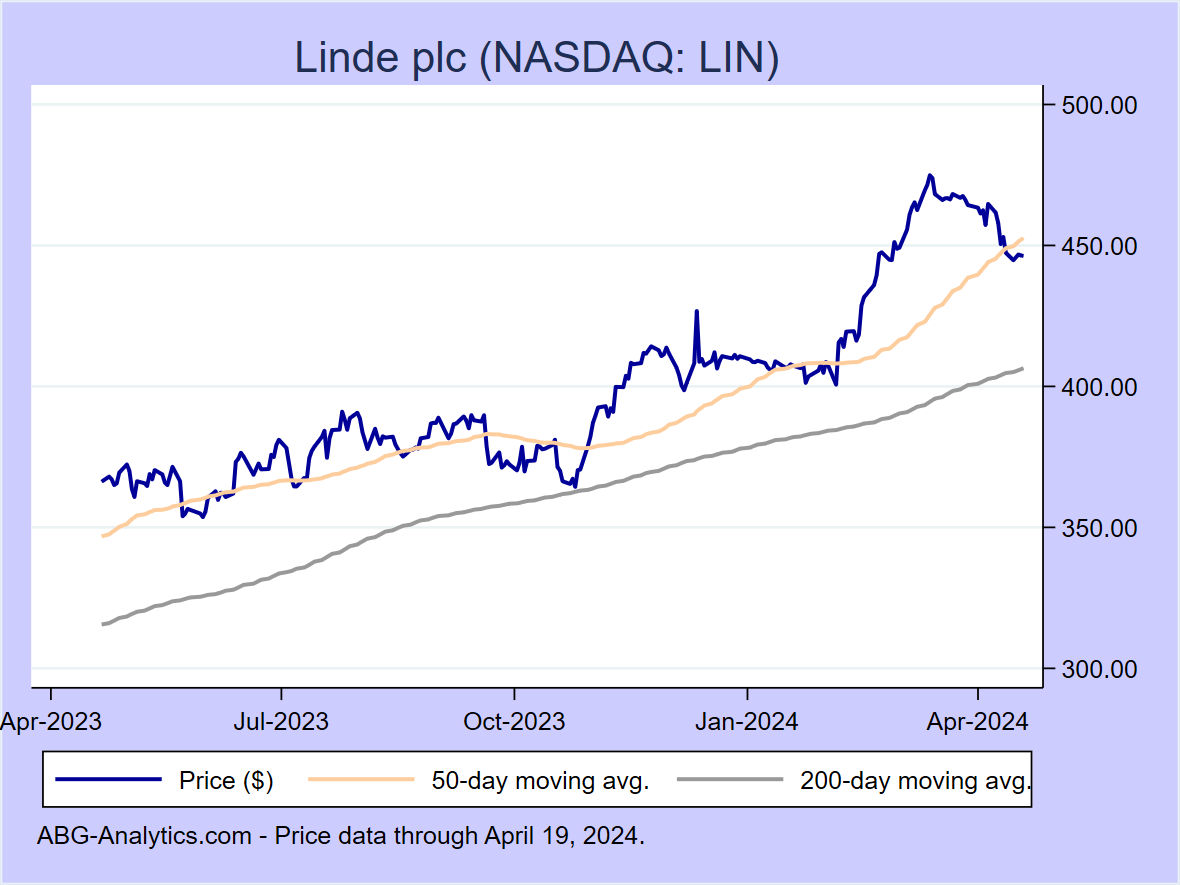
Linde plc (NASDAQ:LIN)
12-month return: 24.5%
12-month return: 24.5%
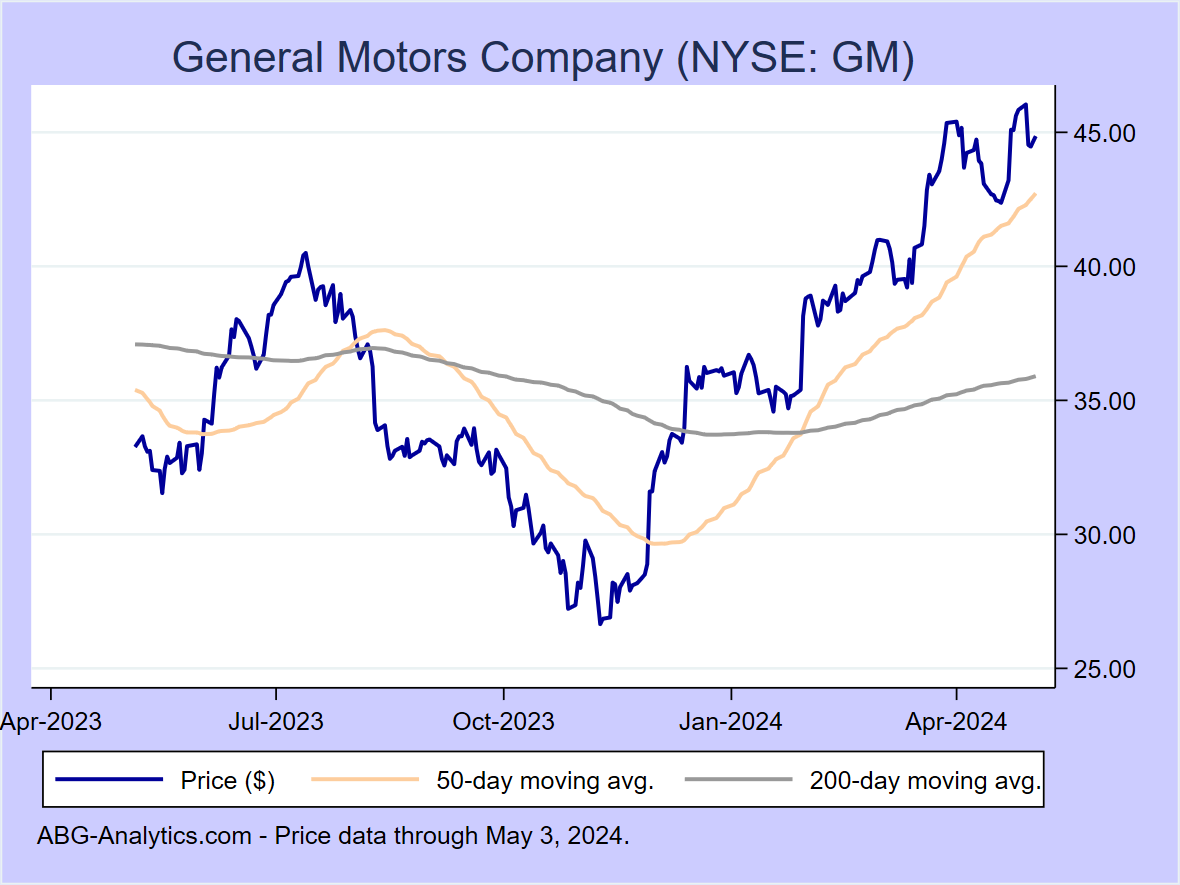
General Motors Company (NYSE:GM)
12-month return: 24.4%
12-month return: 24.4%
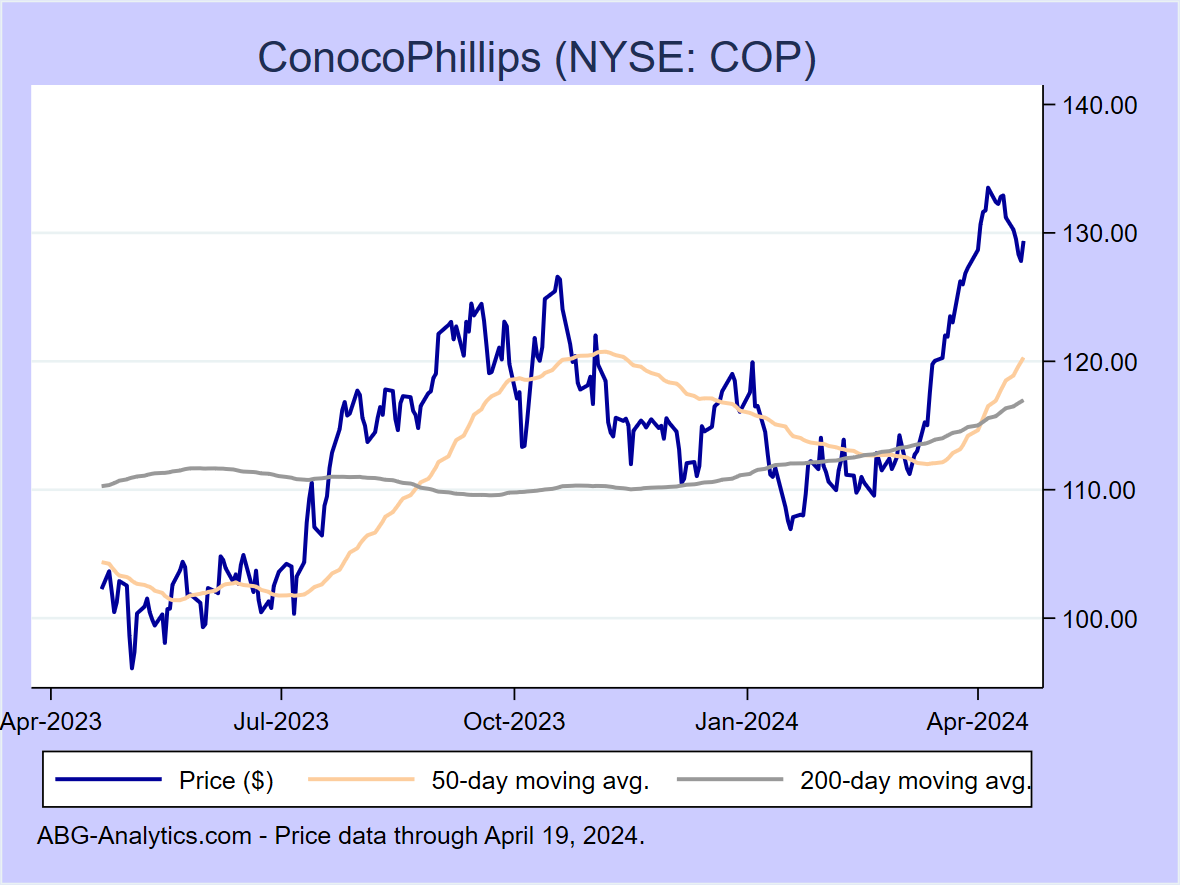
ConocoPhillips (NYSE:COP)
12-month return: 22.0%
12-month return: 22.0%

Visa Inc (NYSE:V)
12-month return: 21.1%
12-month return: 21.1%
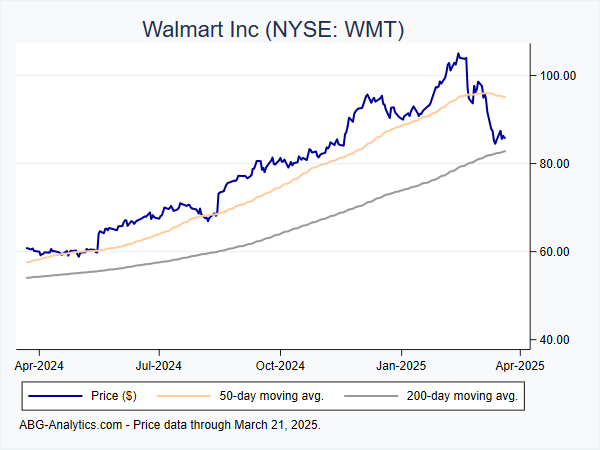
Walmart Inc (NYSE:WMT)
12-month return: 20.8%
12-month return: 20.8%
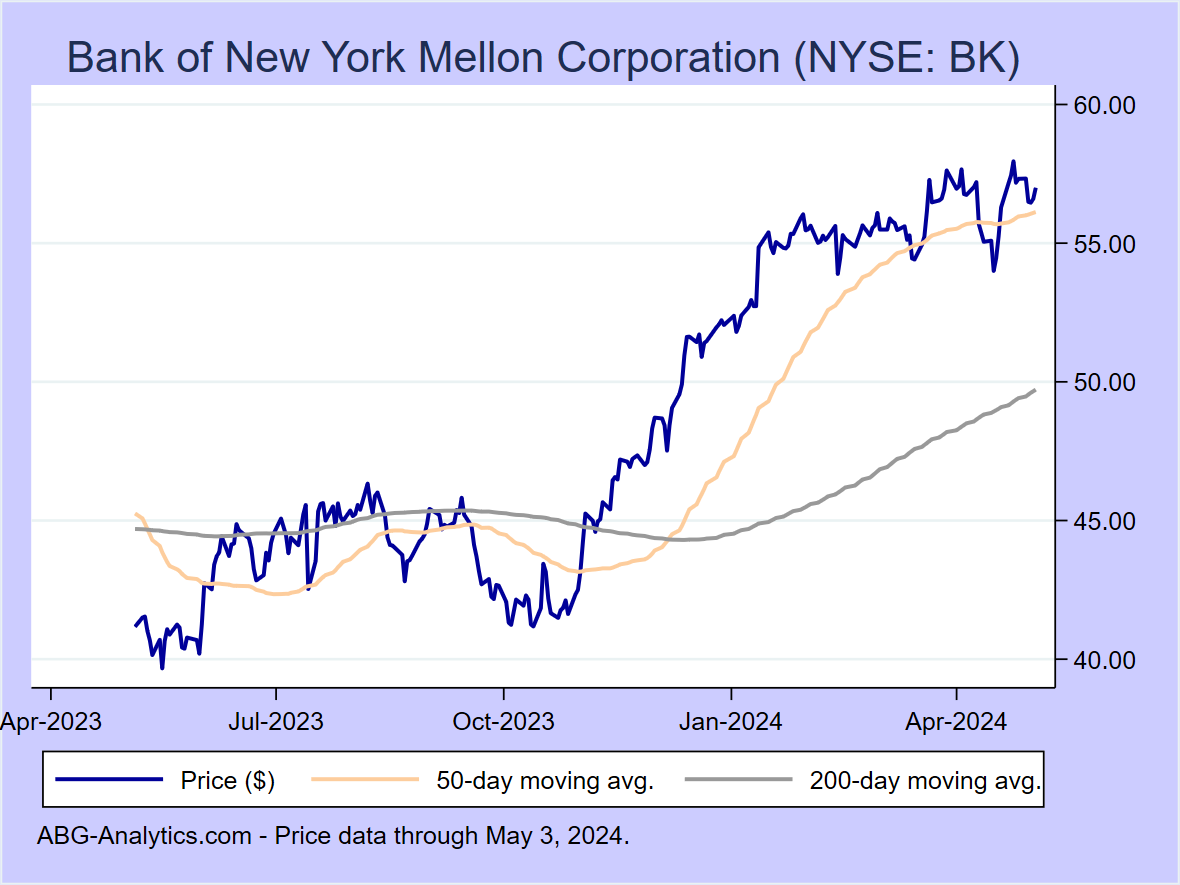
Bank of New York Mellon Corporation (NYSE:BK)
12-month return: 20.1%
12-month return: 20.1%
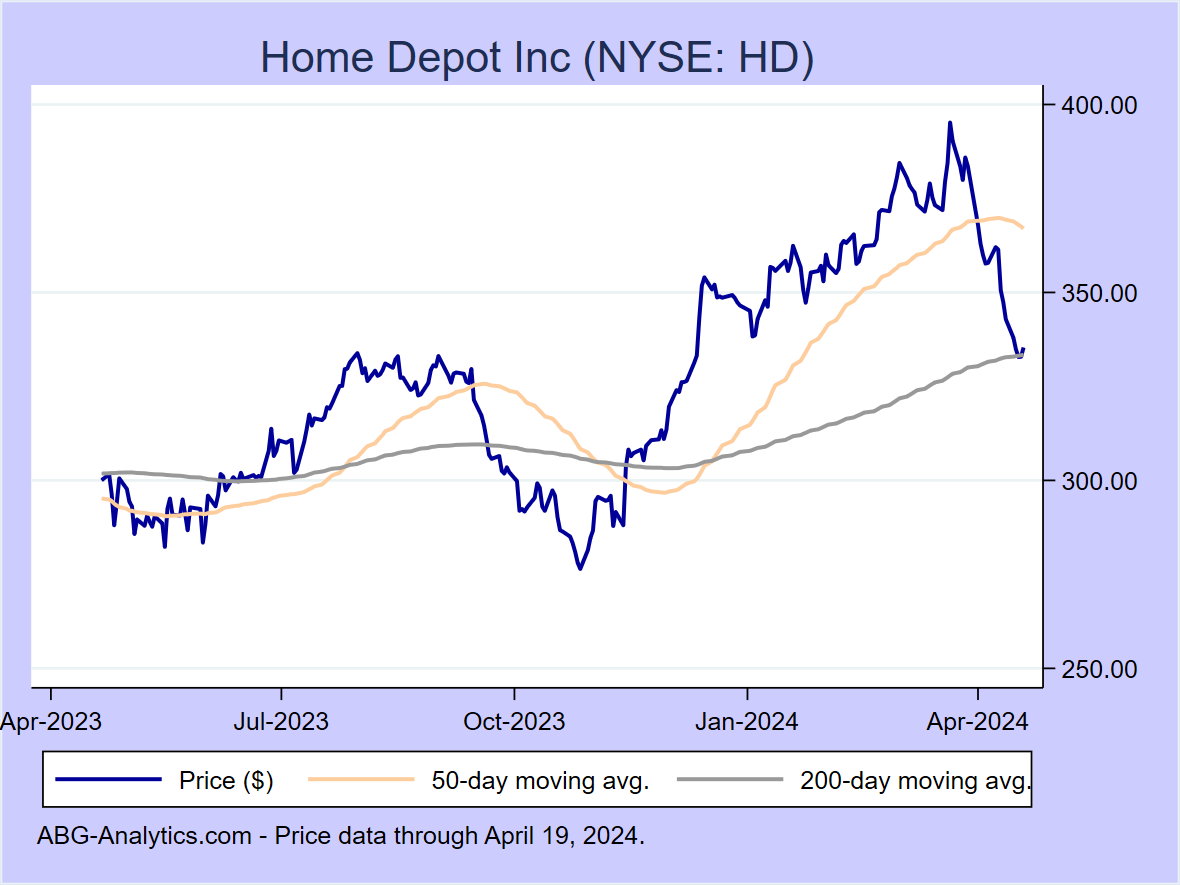
Home Depot Inc (NYSE:HD)
12-month return: 18.1%
12-month return: 18.1%
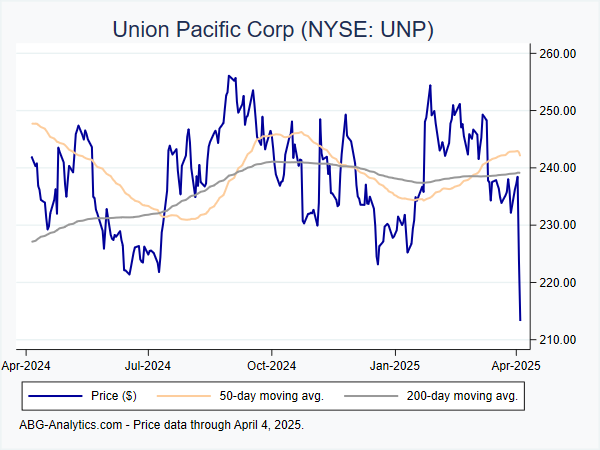
Union Pacific Corp (NYSE:UNP)
12-month return: 17.9%
12-month return: 17.9%
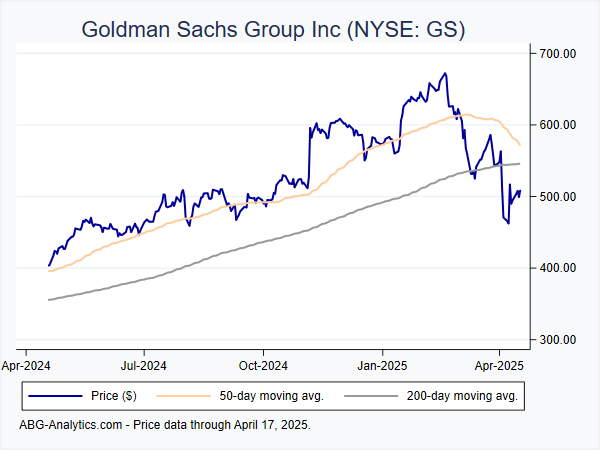
Goldman Sachs Group Inc (NYSE:GS)
12-month return: 17.9%
12-month return: 17.9%
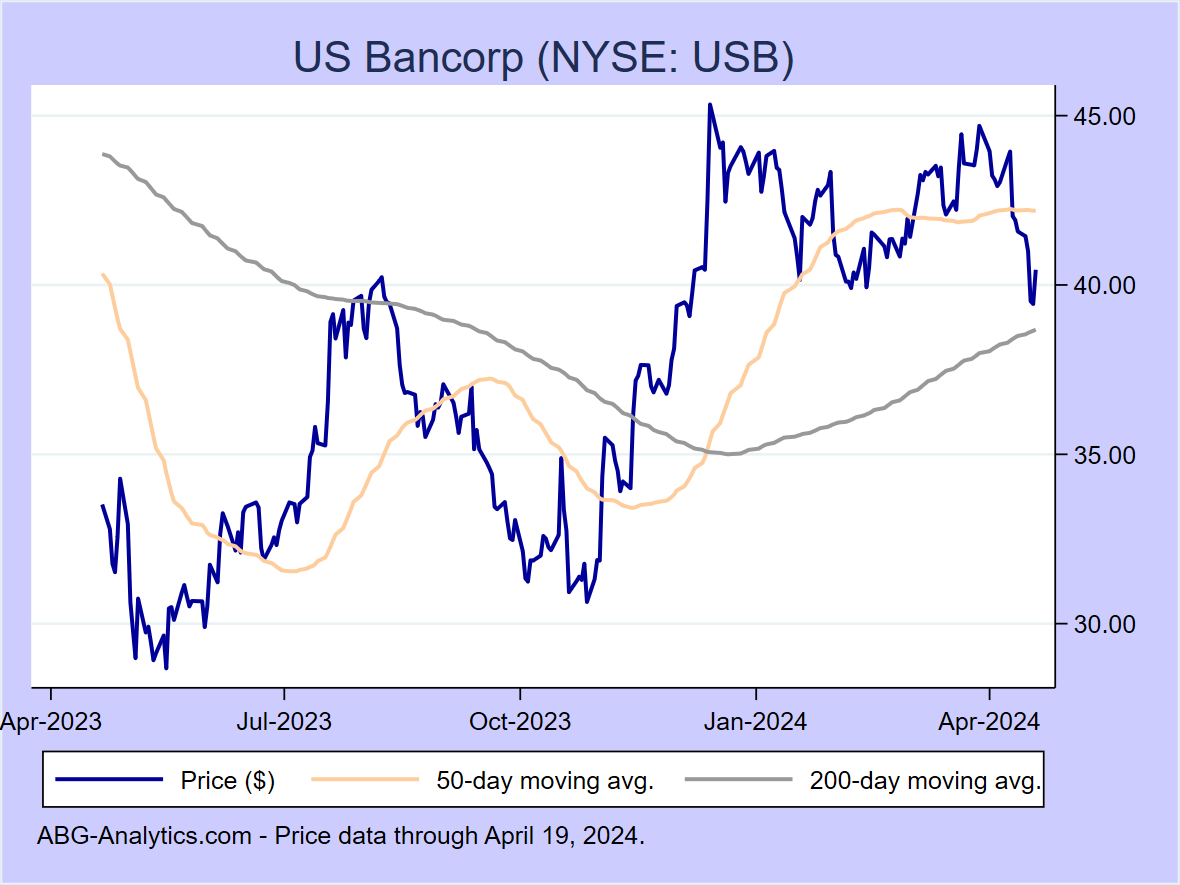
US Bancorp (NYSE:USB)
12-month return: 17.5%
12-month return: 17.5%
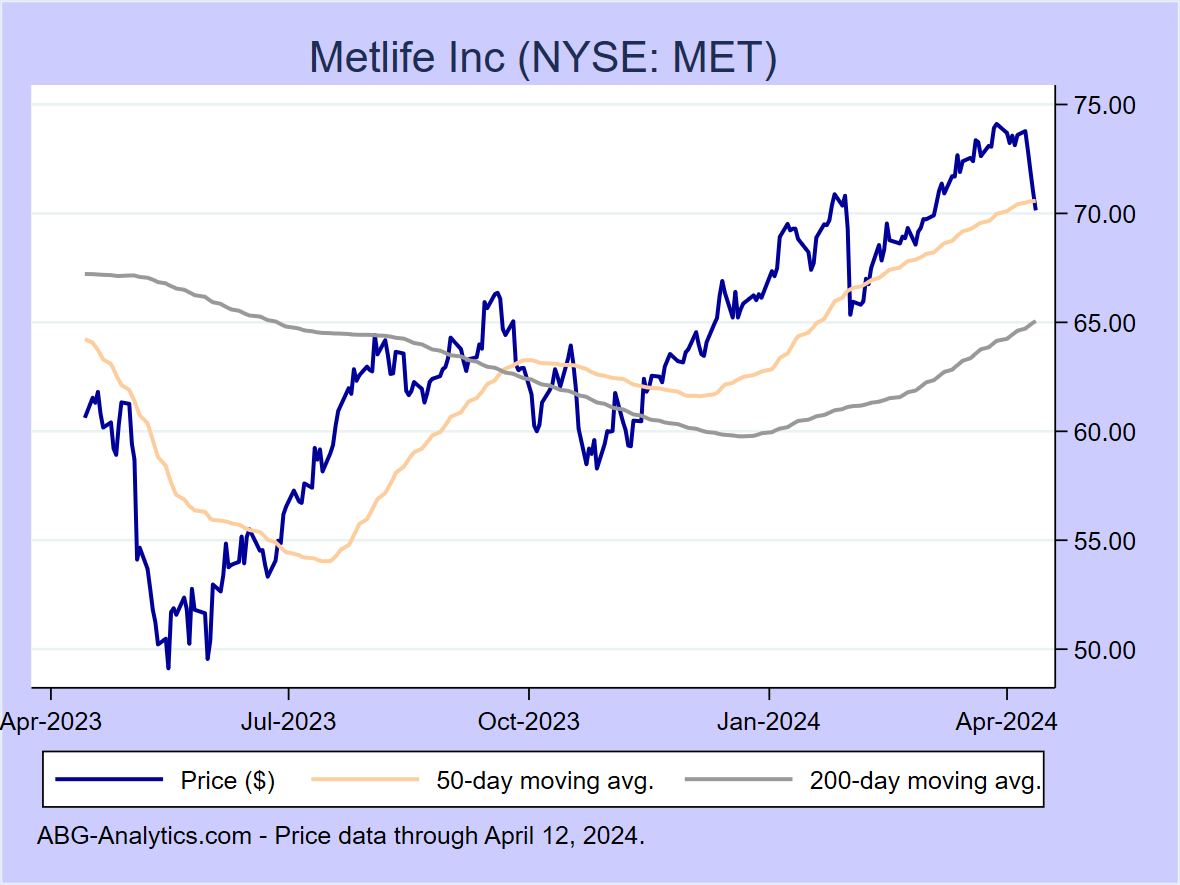
Metlife Inc (NYSE:MET)
12-month return: 16.9%
12-month return: 16.9%
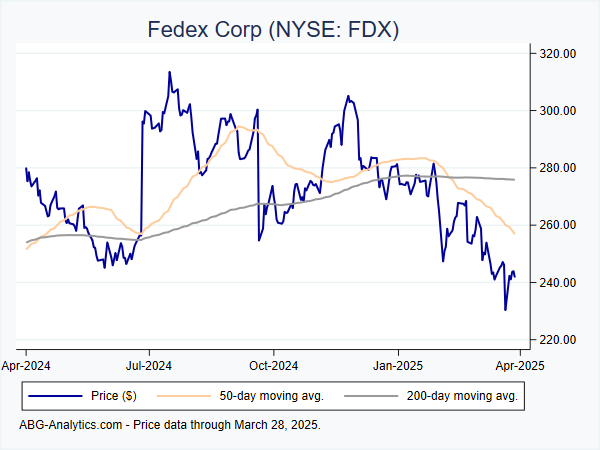
Fedex Corp (NYSE:FDX)
12-month return: 16.7%
12-month return: 16.7%
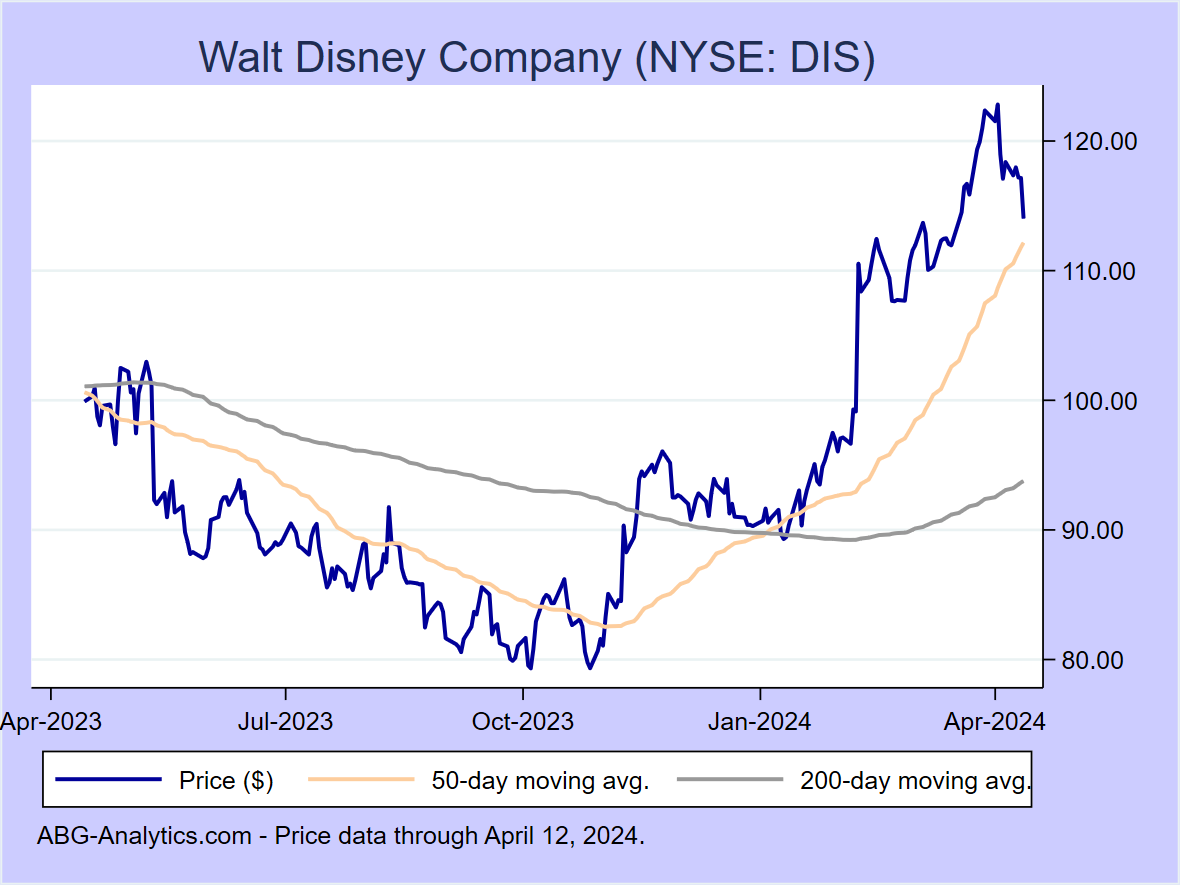
Walt Disney Company (NYSE:DIS)
12-month return: 16.4%
12-month return: 16.4%
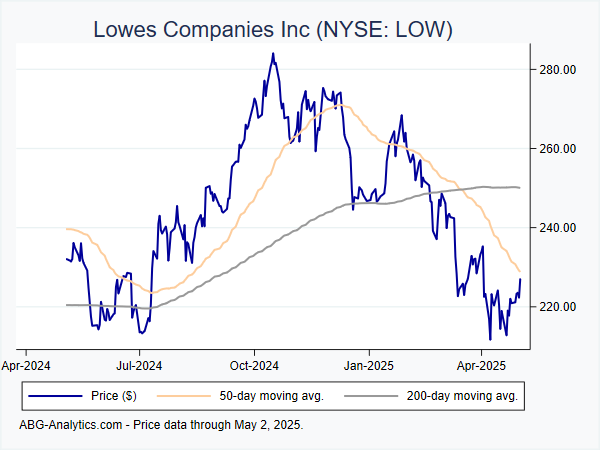
Lowes Companies Inc (NYSE:LOW)
12-month return: 16.2%
12-month return: 16.2%
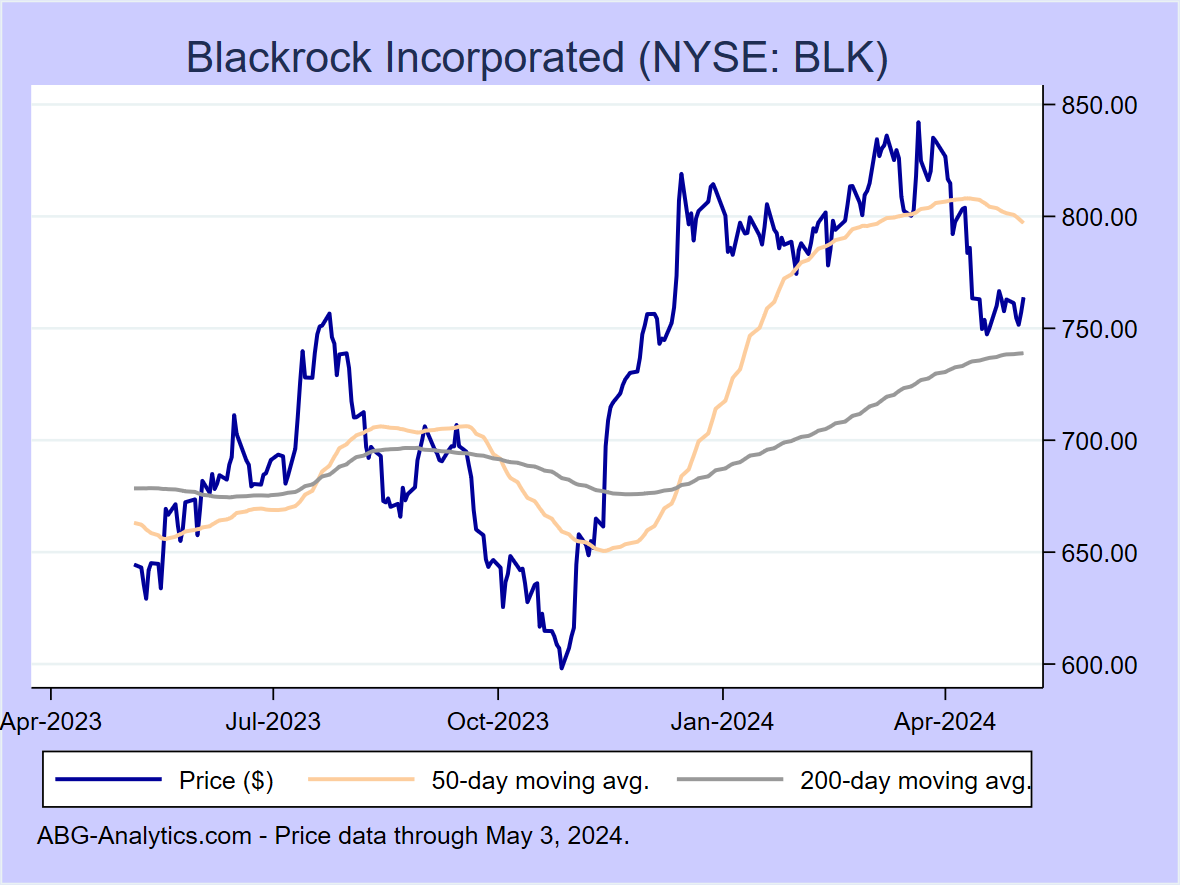
Blackrock Incorporated (NYSE:BLK)
12-month return: 14.6%
12-month return: 14.6%
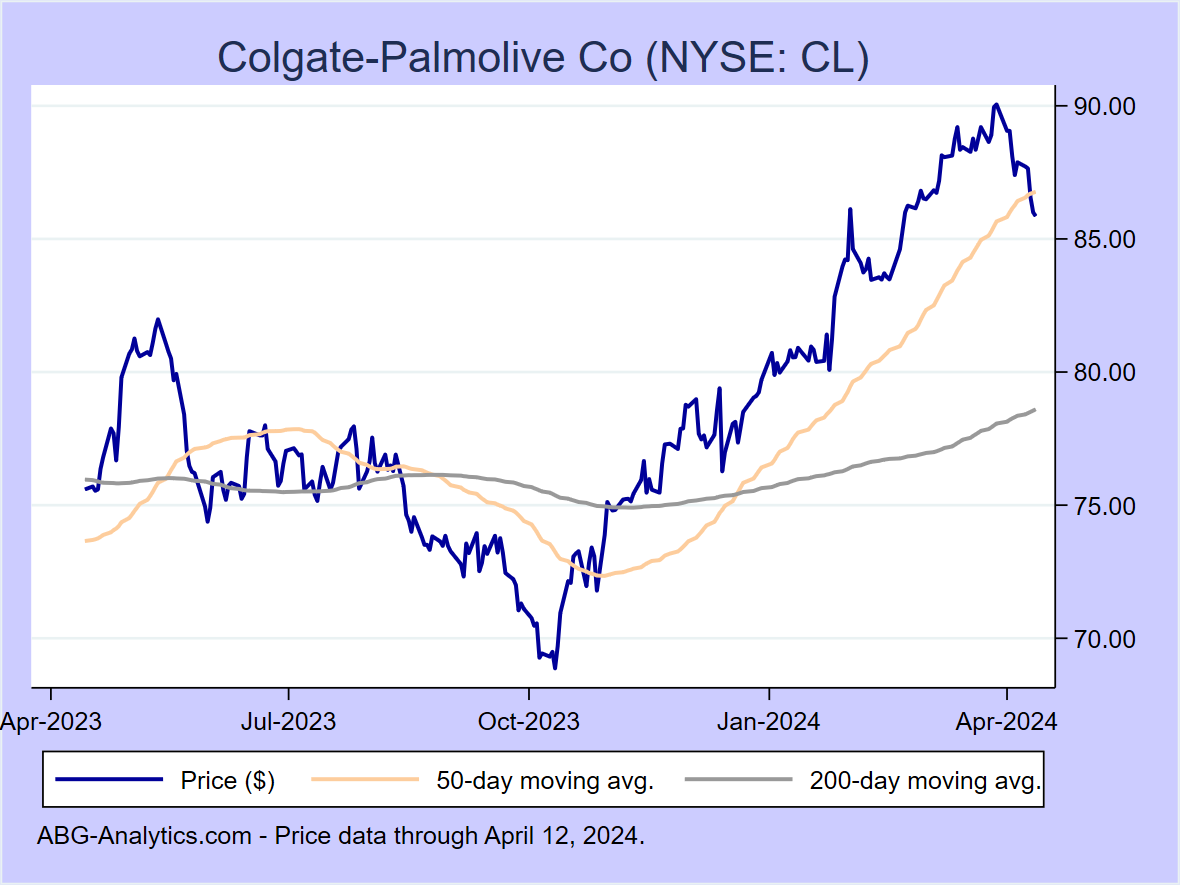
Colgate-Palmolive Co (NYSE:CL)
12-month return: 12.9%
12-month return: 12.9%
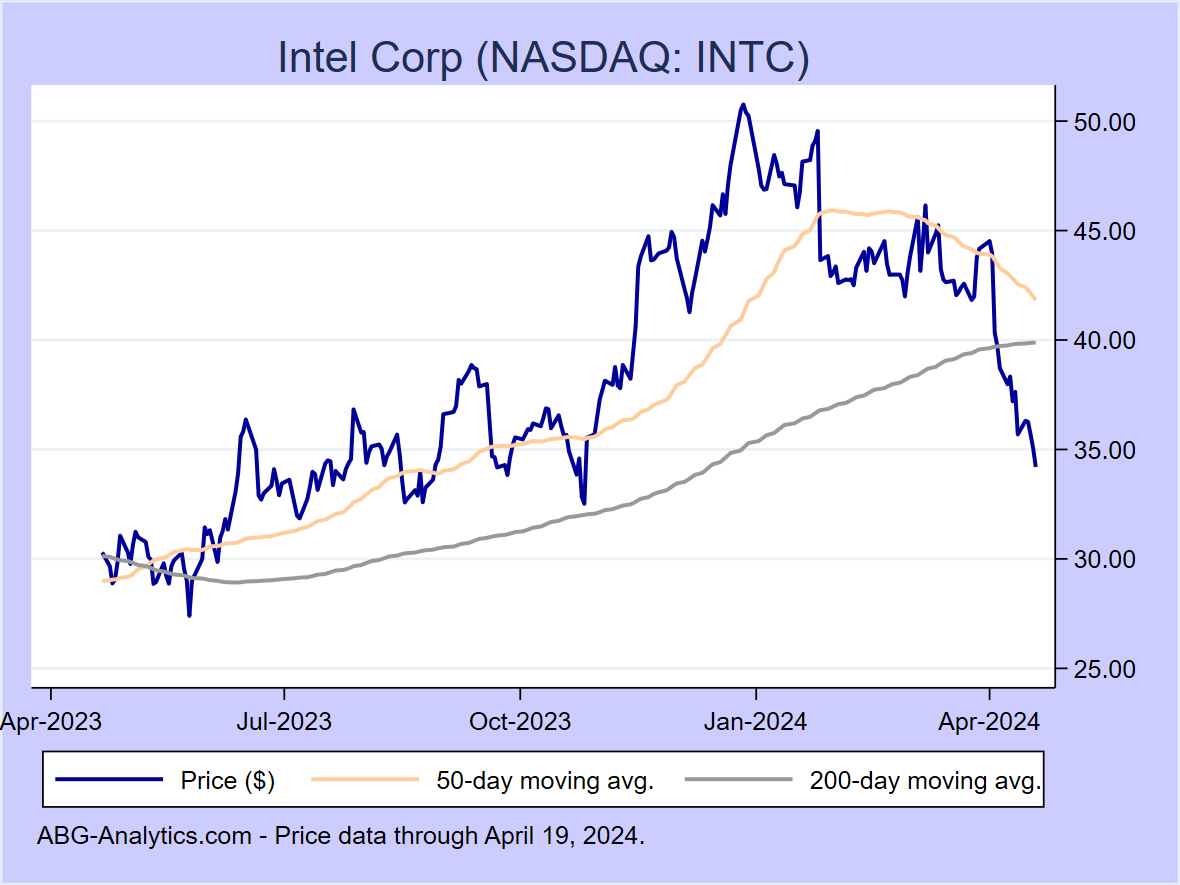
Intel Corp (NASDAQ:INTC)
12-month return: 11.5%
12-month return: 11.5%

Accenture Ltd (NYSE:ACN)
12-month return: 11.2%
12-month return: 11.2%
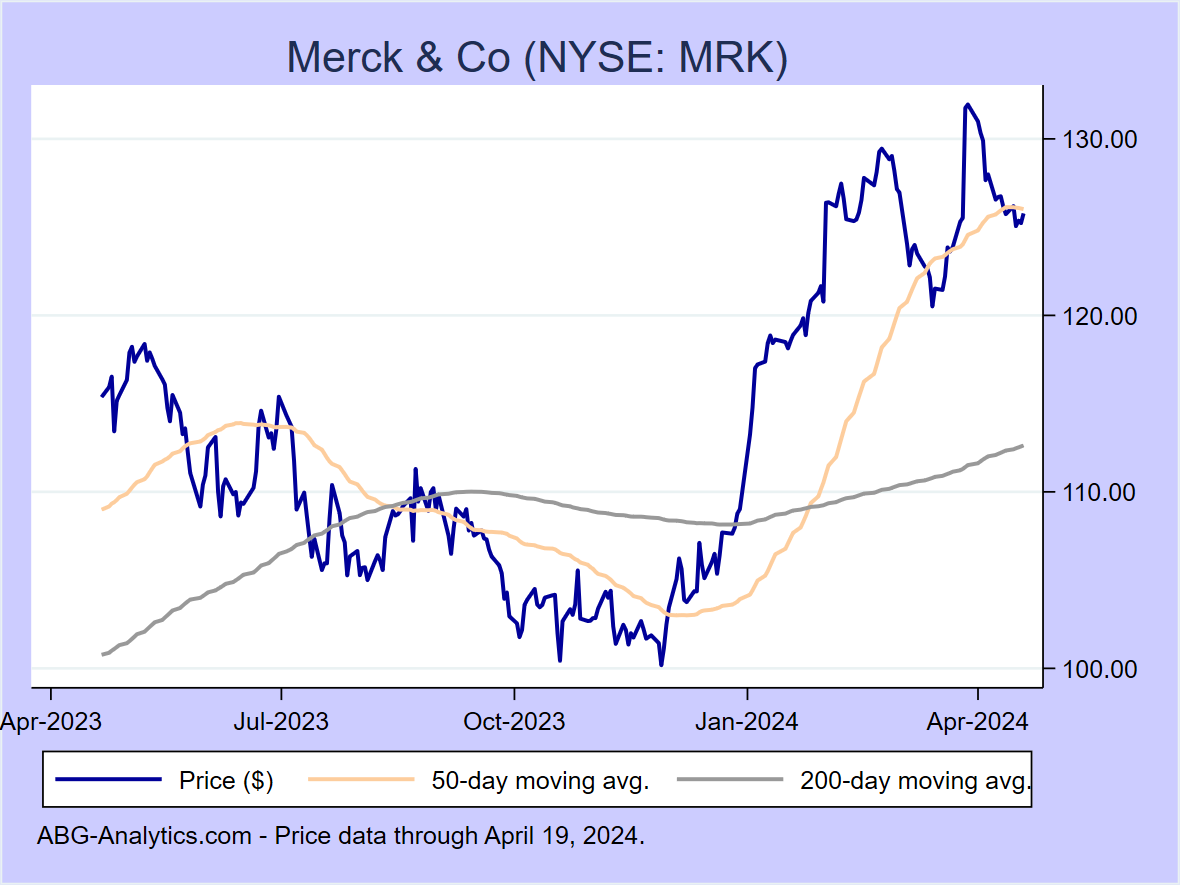
Merck & Co (NYSE:MRK)
12-month return: 10.5%
12-month return: 10.5%
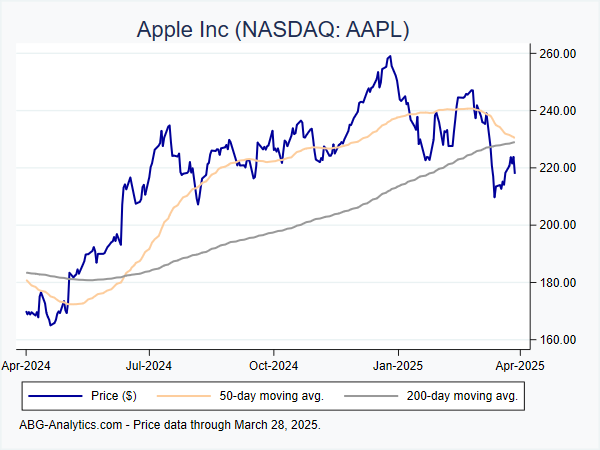
Apple Inc (NASDAQ:AAPL)
12-month return: 10.3%
12-month return: 10.3%
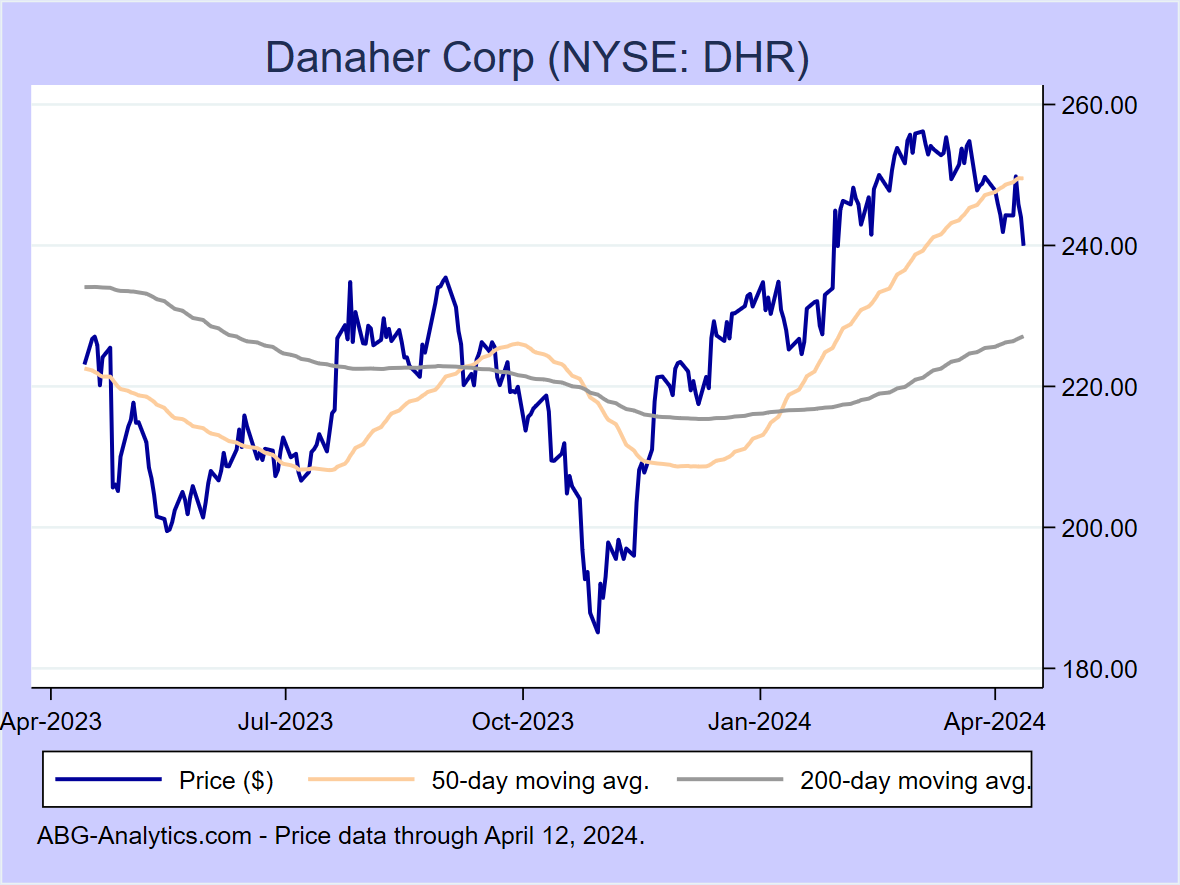
Danaher Corp (NYSE:DHR)
12-month return: 8.3%
12-month return: 8.3%
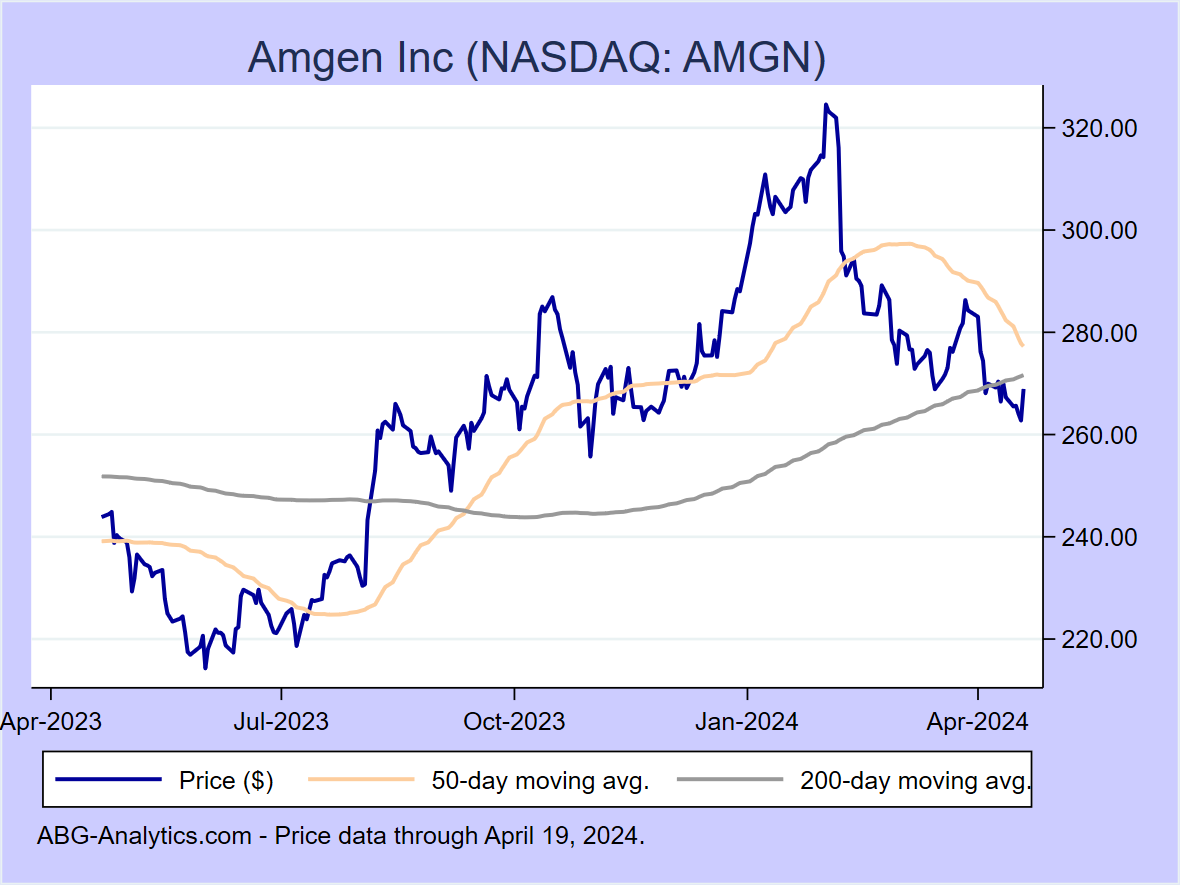
Amgen Inc (NASDAQ:AMGN)
12-month return: 7.1%
12-month return: 7.1%
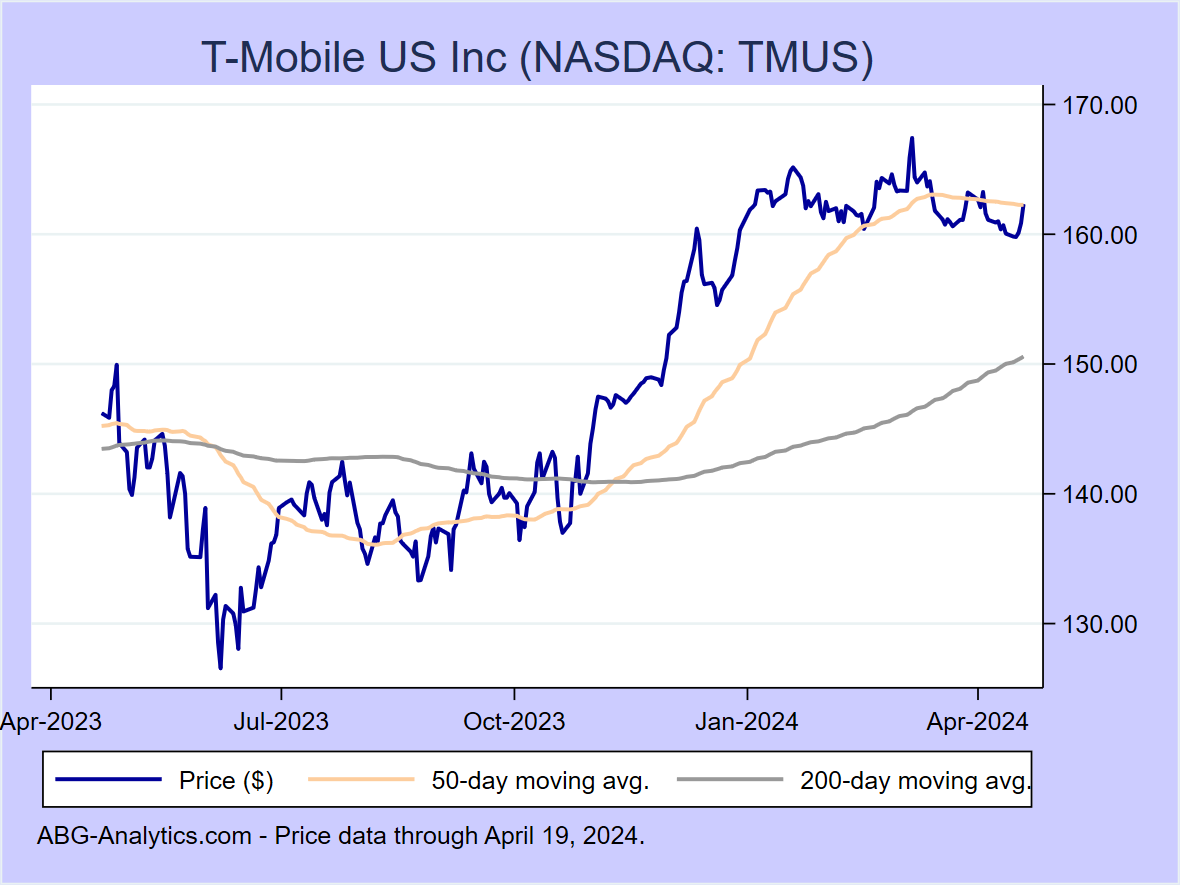
T-Mobile US Inc (NASDAQ:TMUS)
12-month return: 7.0%
12-month return: 7.0%
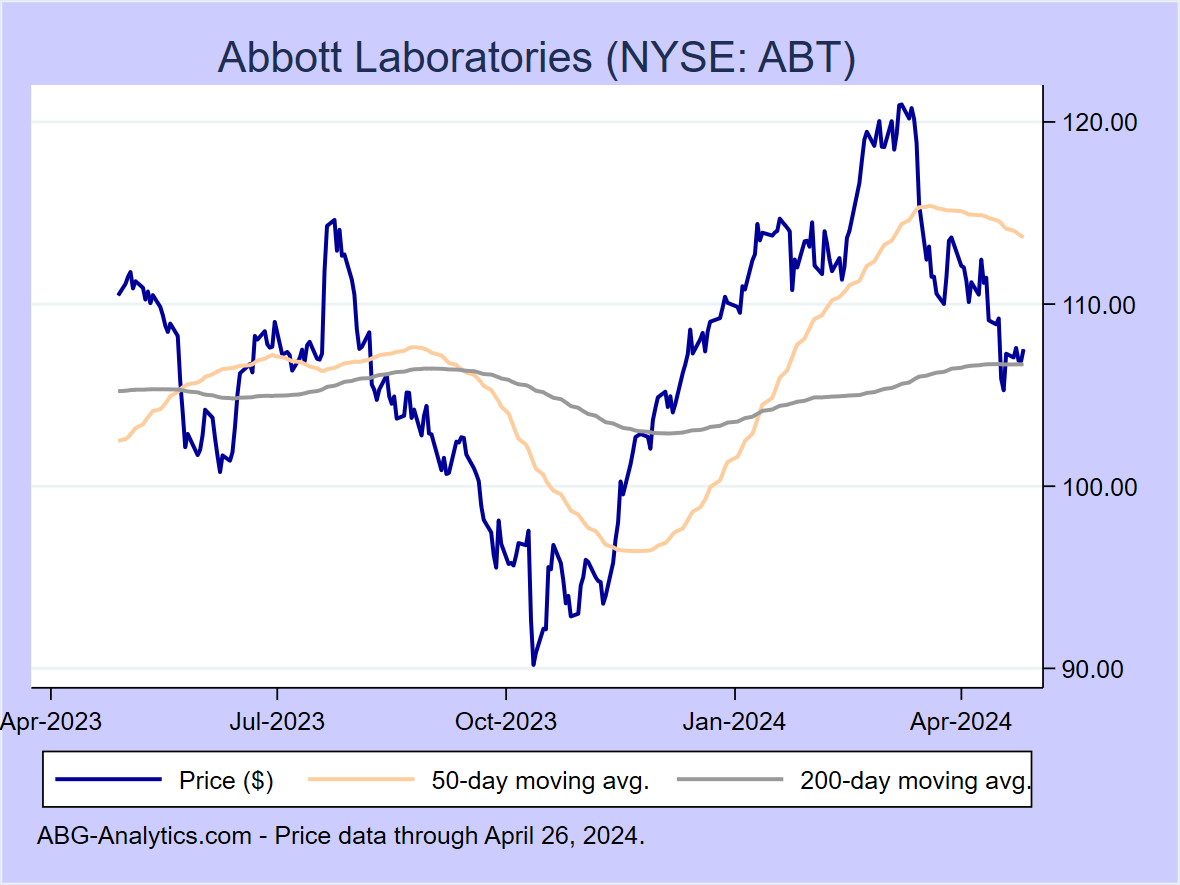
Abbott Laboratories (NYSE:ABT)
12-month return: 6.4%
12-month return: 6.4%
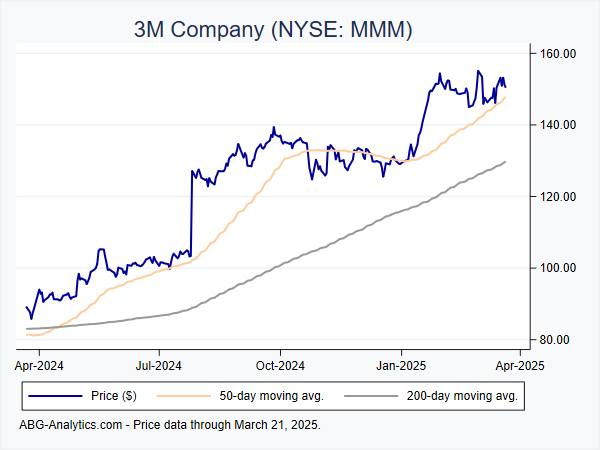
3M Company (NYSE:MMM)
12-month return: 4.6%
12-month return: 4.6%
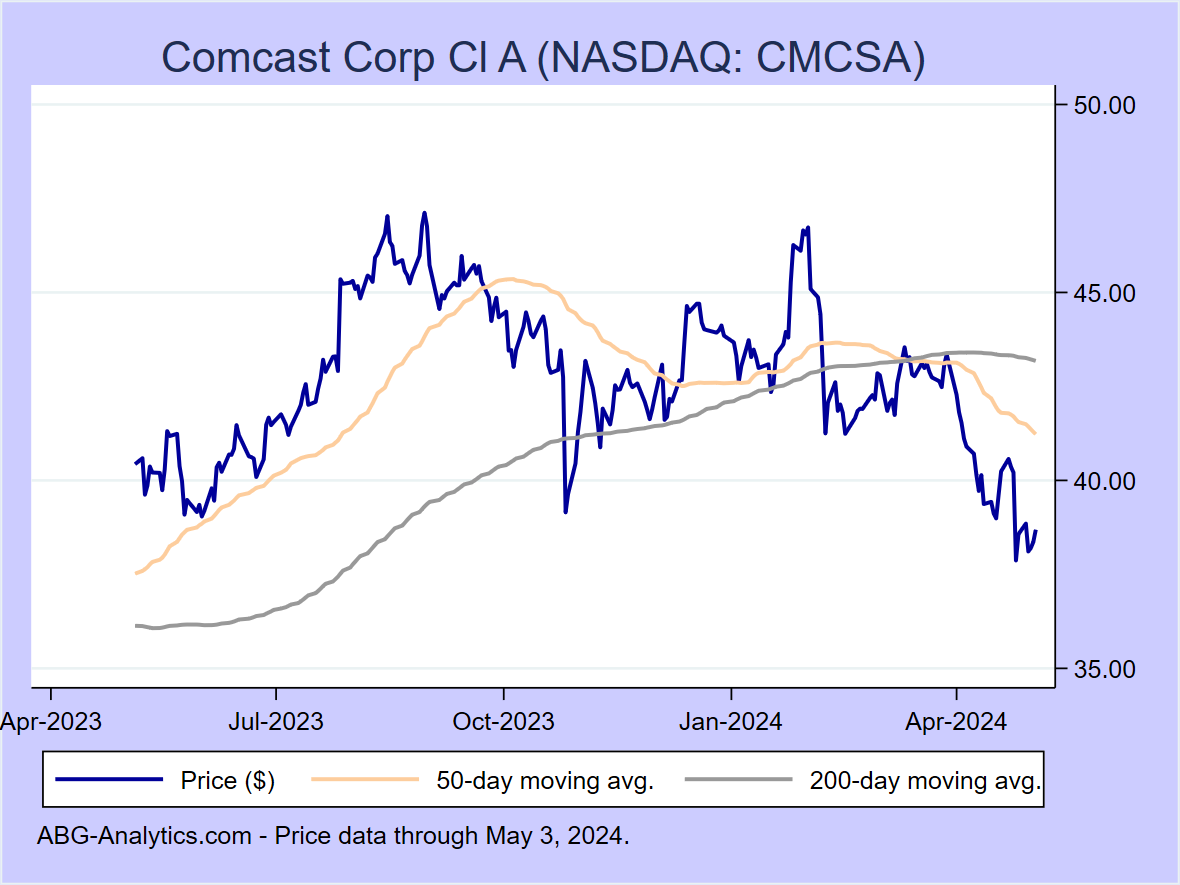
Comcast Corp Cl A (NASDAQ:CMCSA)
12-month return: 4.6%
12-month return: 4.6%
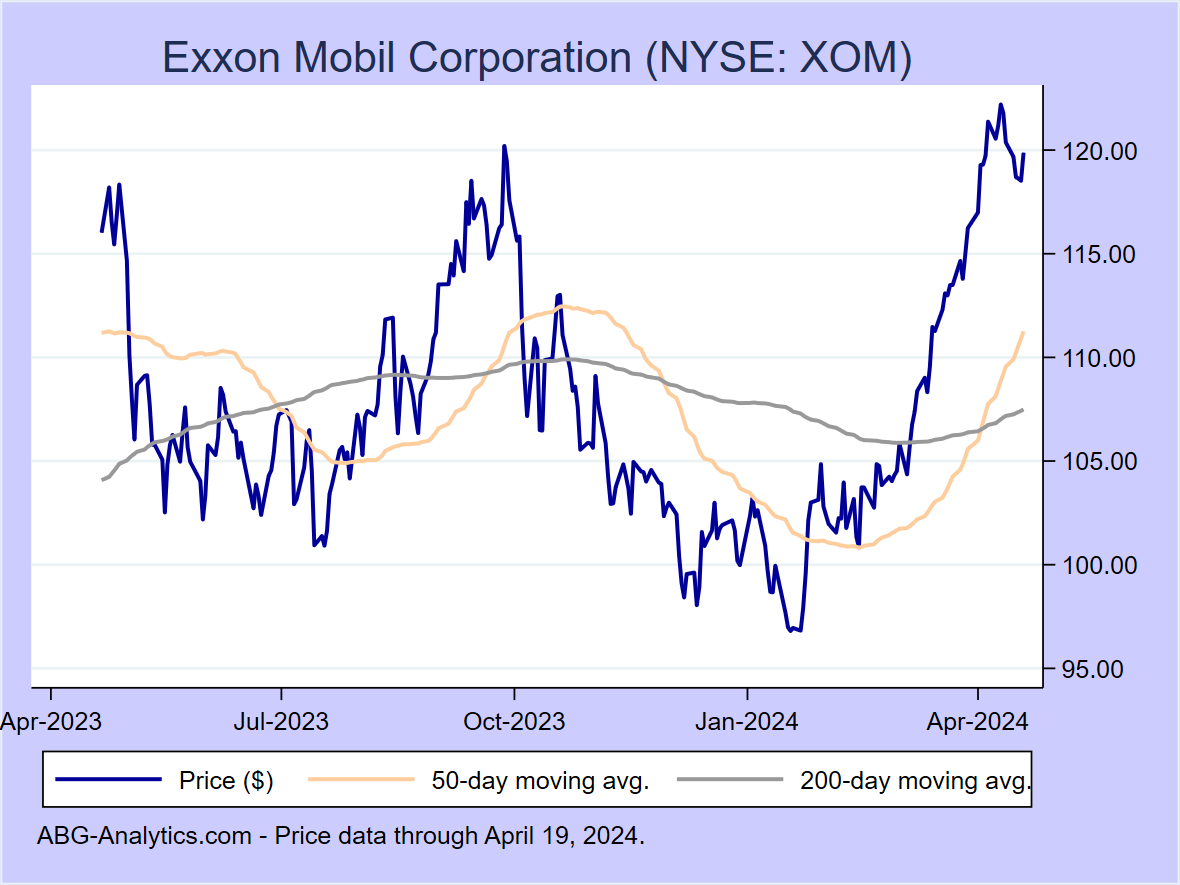
Exxon Mobil Corporation (NYSE:XOM)
12-month return: 4.5%
12-month return: 4.5%
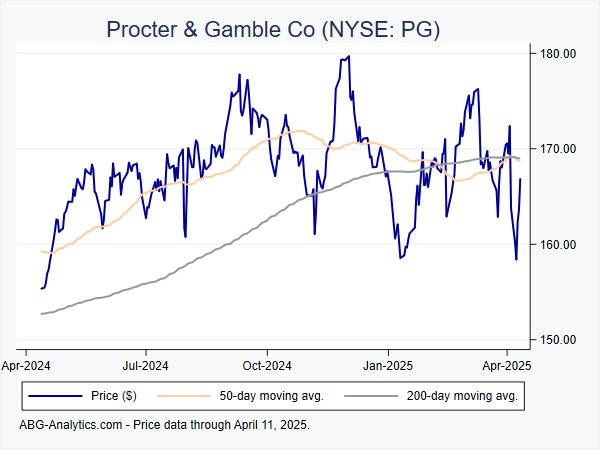
Procter & Gamble Co (NYSE:PG)
12-month return: 2.8%
12-month return: 2.8%
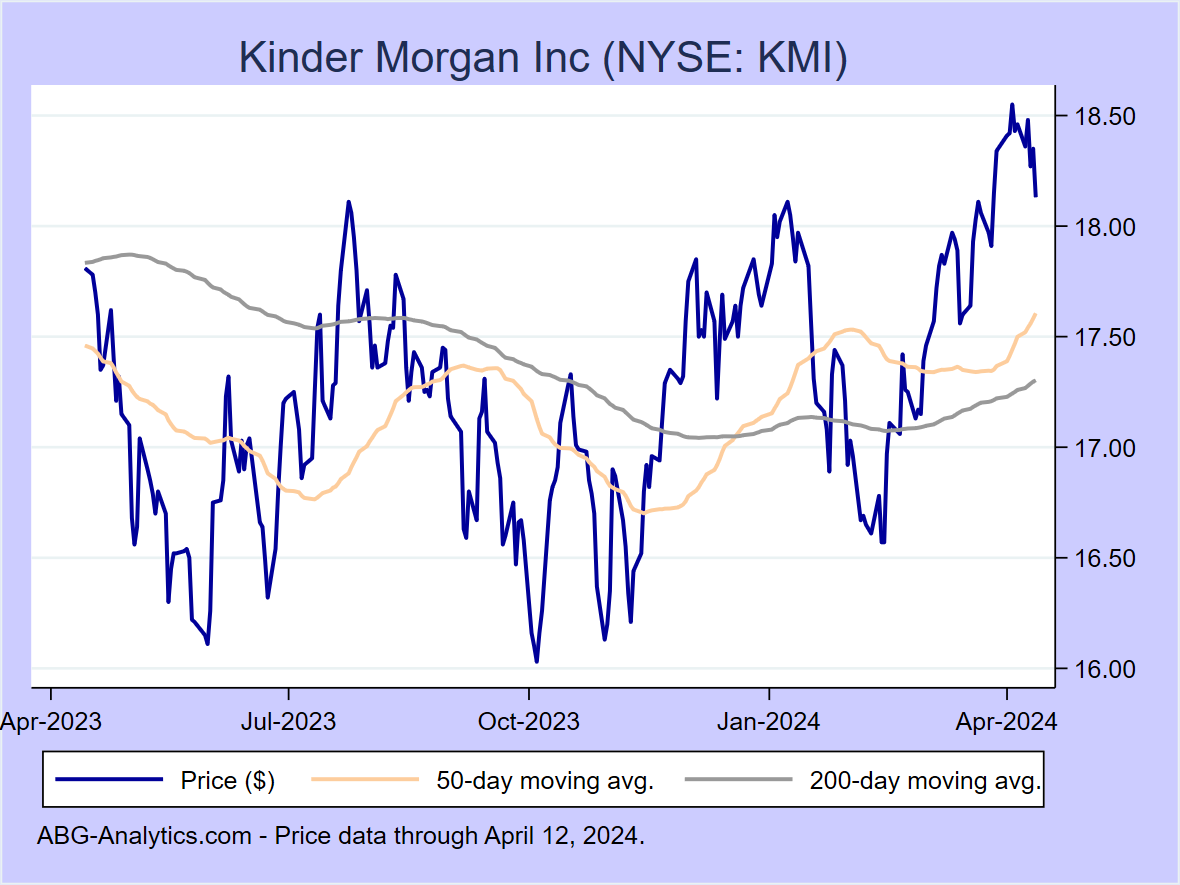
Kinder Morgan Inc (NYSE:KMI)
12-month return: 1.7%
12-month return: 1.7%

Target Corporation (NYSE:TGT)
12-month return: 1.6%
12-month return: 1.6%
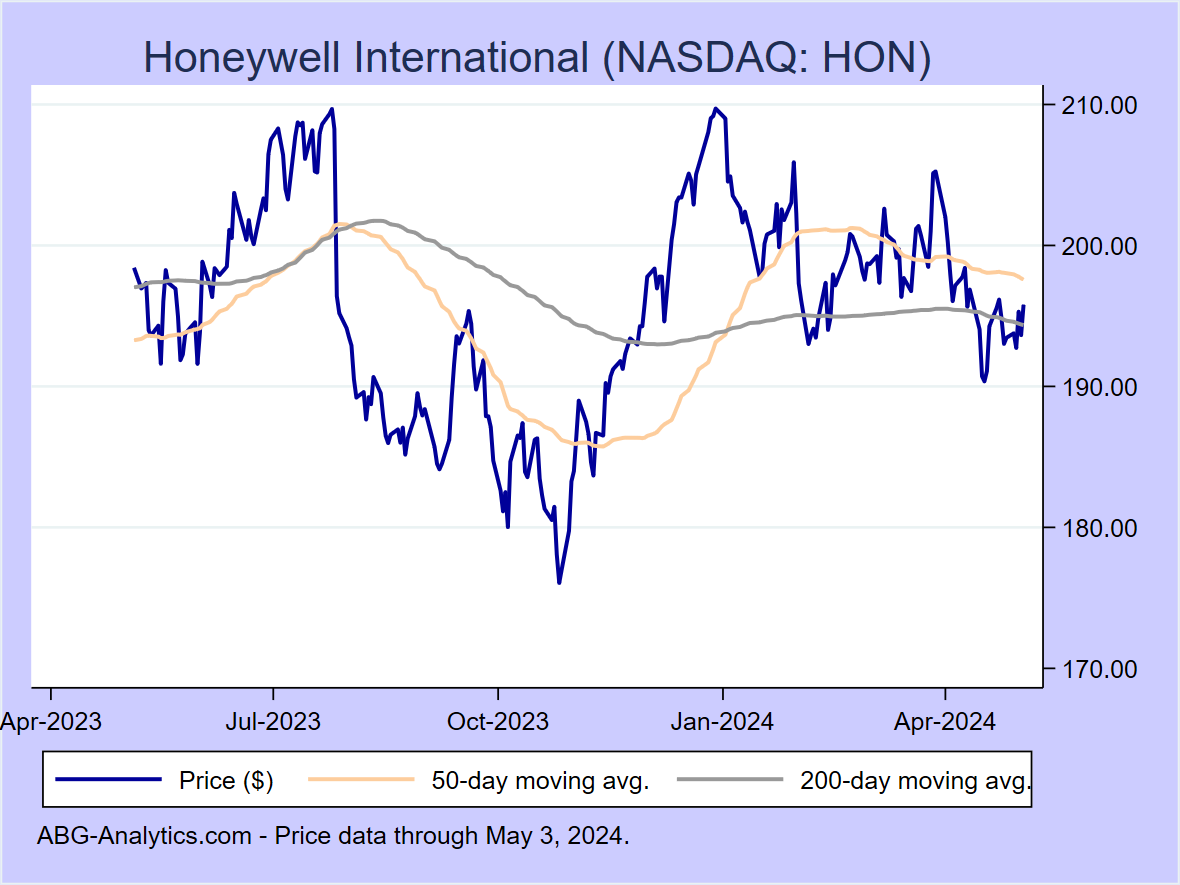
Honeywell International (NASDAQ:HON)
12-month return: 1.5%
12-month return: 1.5%
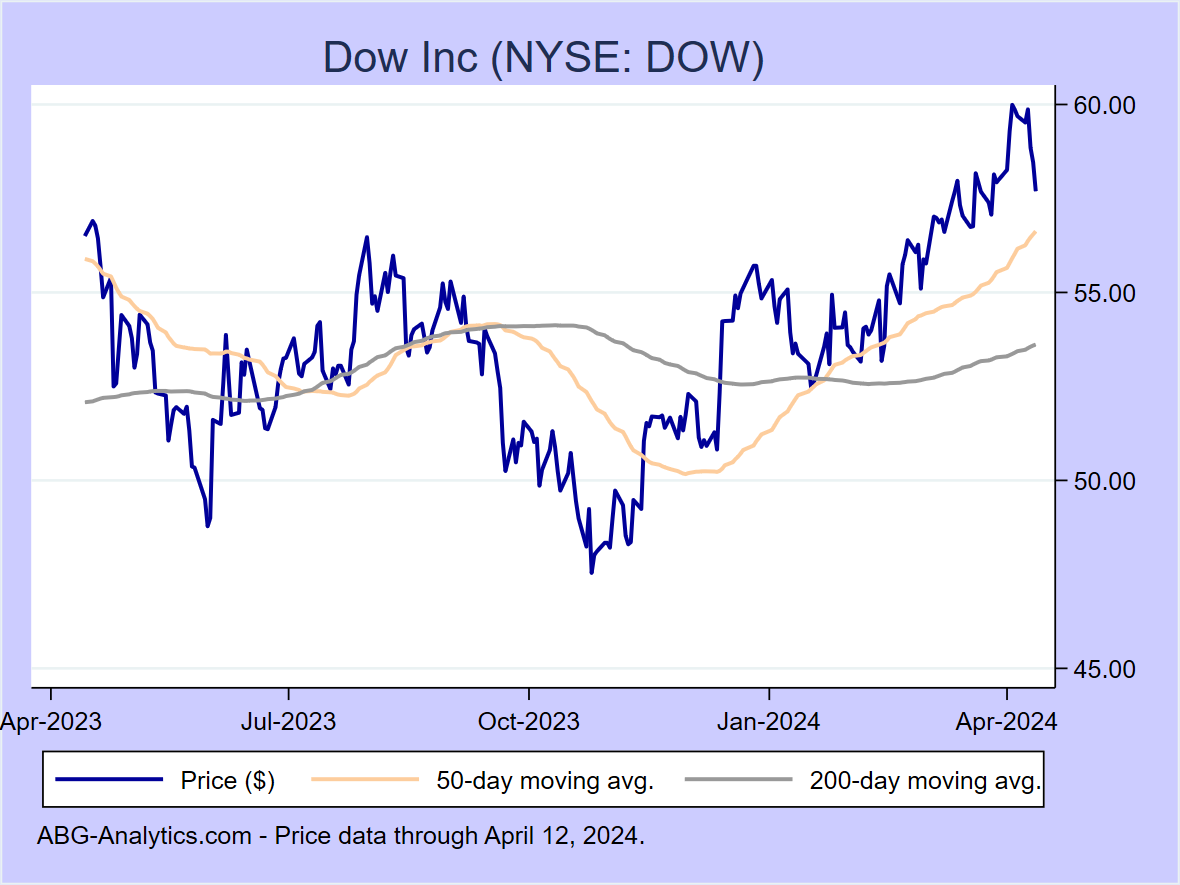
Dow Inc (NYSE:DOW)
12-month return: 1.4%
12-month return: 1.4%
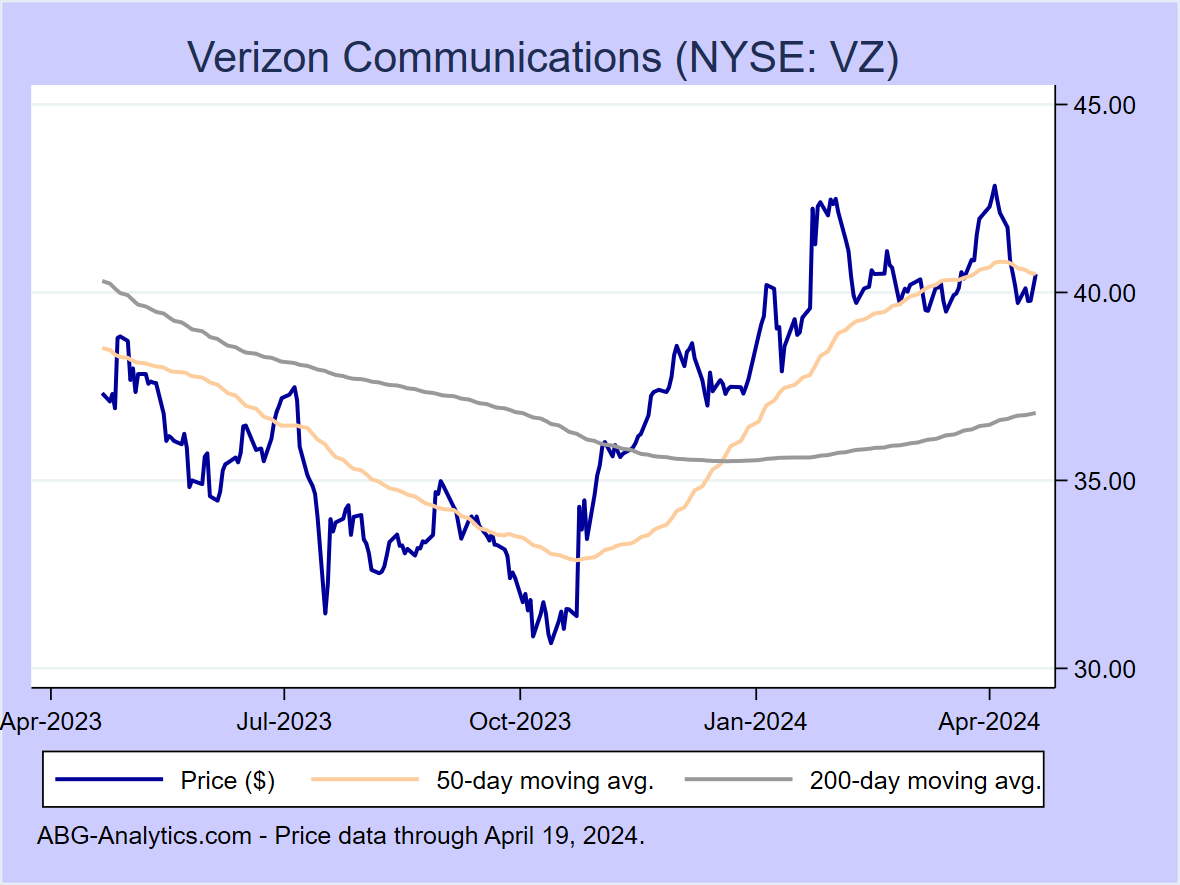
Verizon Communications (NYSE:VZ)
12-month return: 1.3%
12-month return: 1.3%
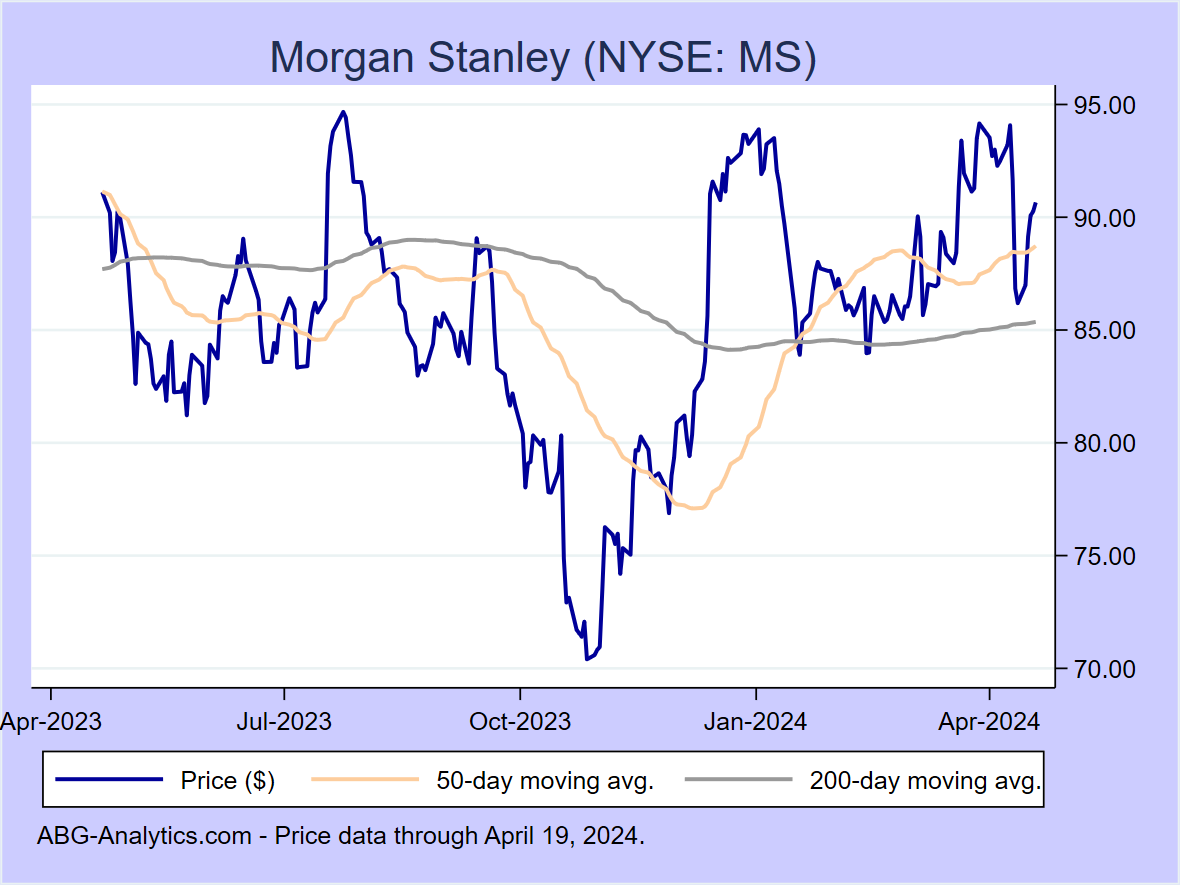
Morgan Stanley (NYSE:MS)
12-month return: 0.8%
12-month return: 0.8%
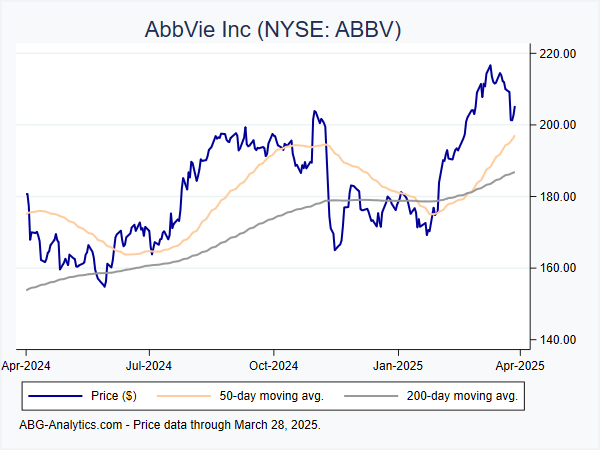
AbbVie Inc (NYSE:ABBV)
12-month return: -0.0%
12-month return: -0.0%

Ford Motor Co (NYSE:F)
12-month return: -0.5%
12-month return: -0.5%
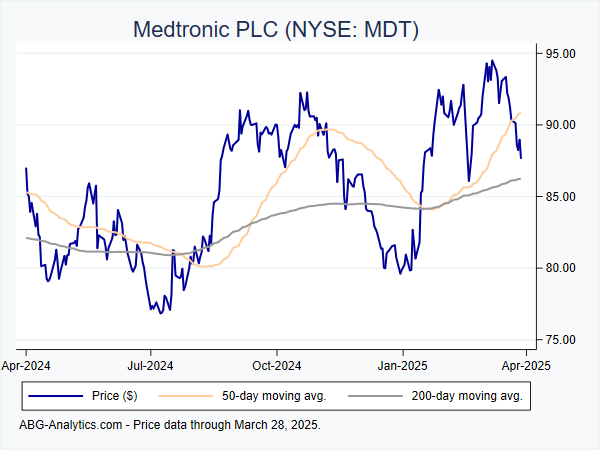
Medtronic PLC (NYSE:MDT)
12-month return: -0.8%
12-month return: -0.8%
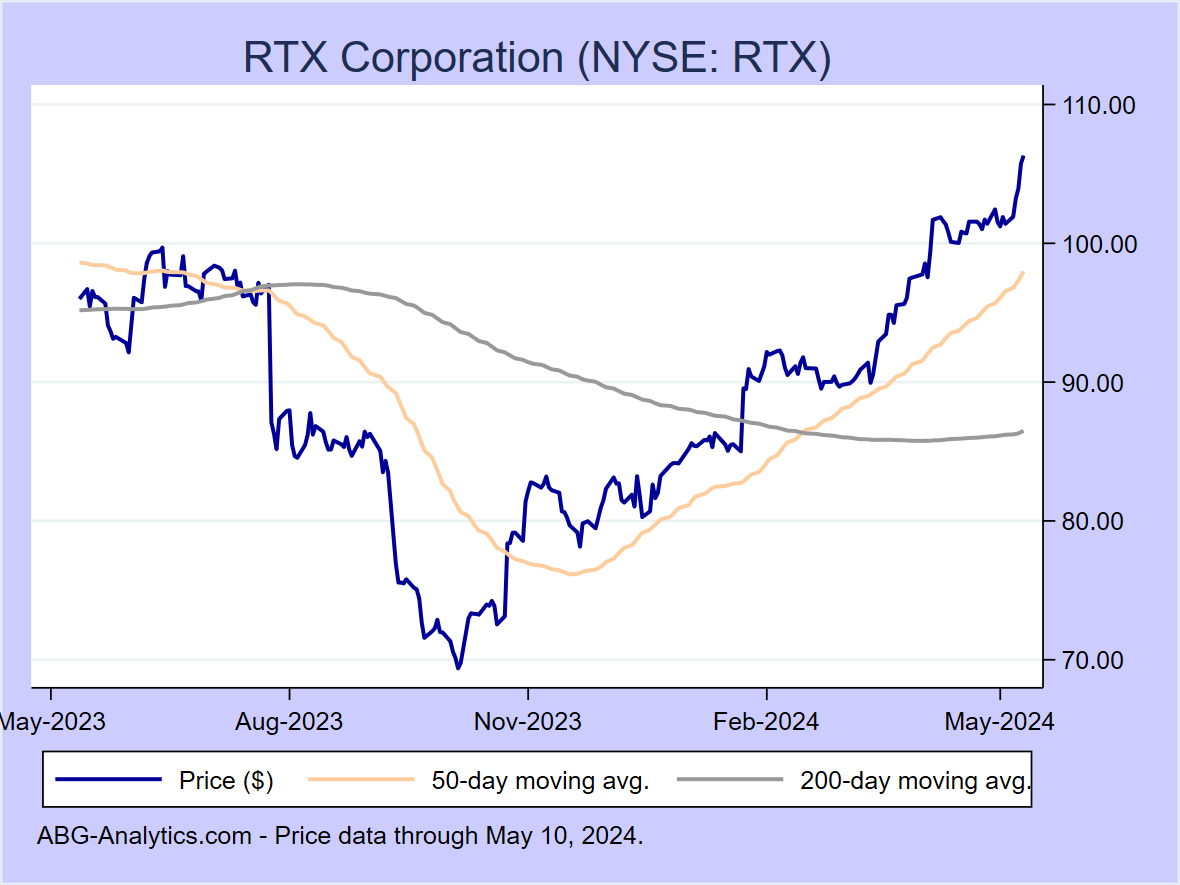
RTX Corporation (NYSE:RTX)
12-month return: -1.4%
12-month return: -1.4%
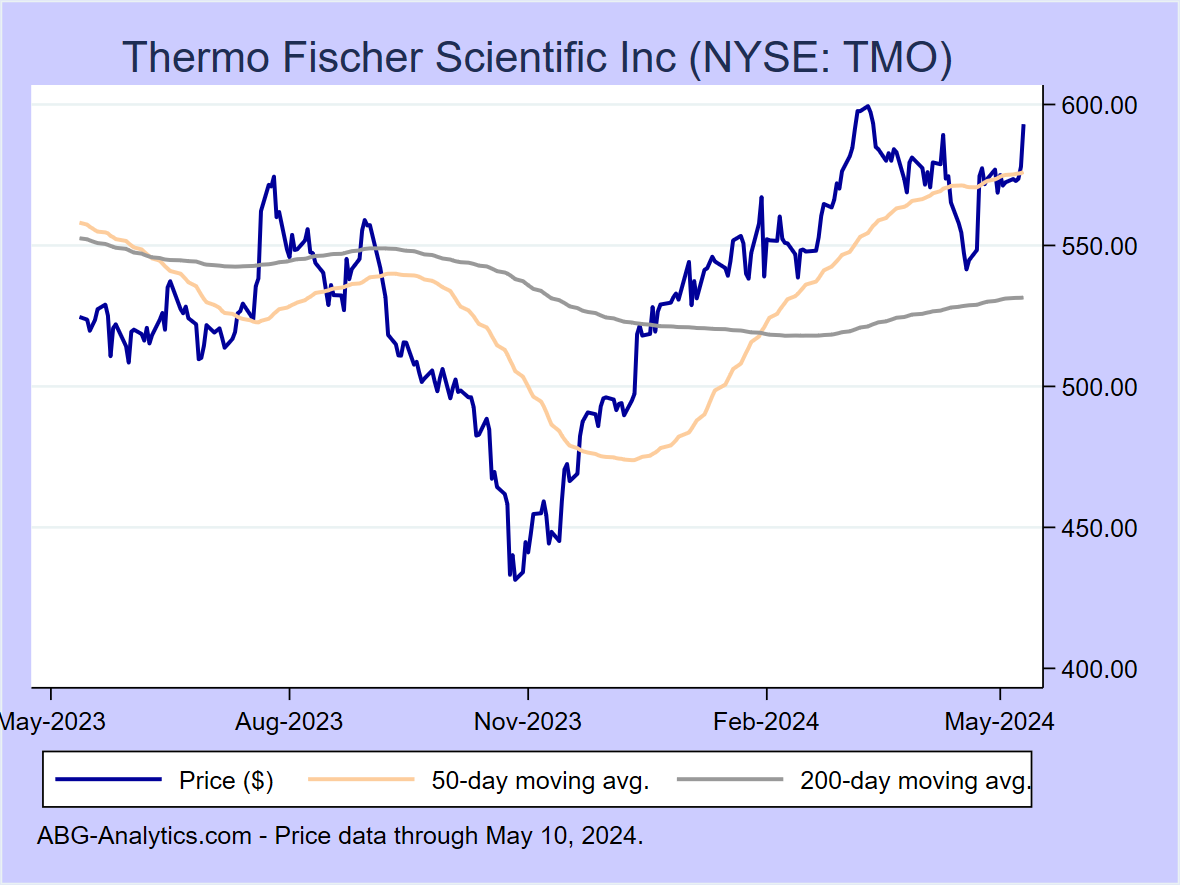
Thermo Fischer Scientific Inc (NYSE:TMO)
12-month return: -2.4%
12-month return: -2.4%
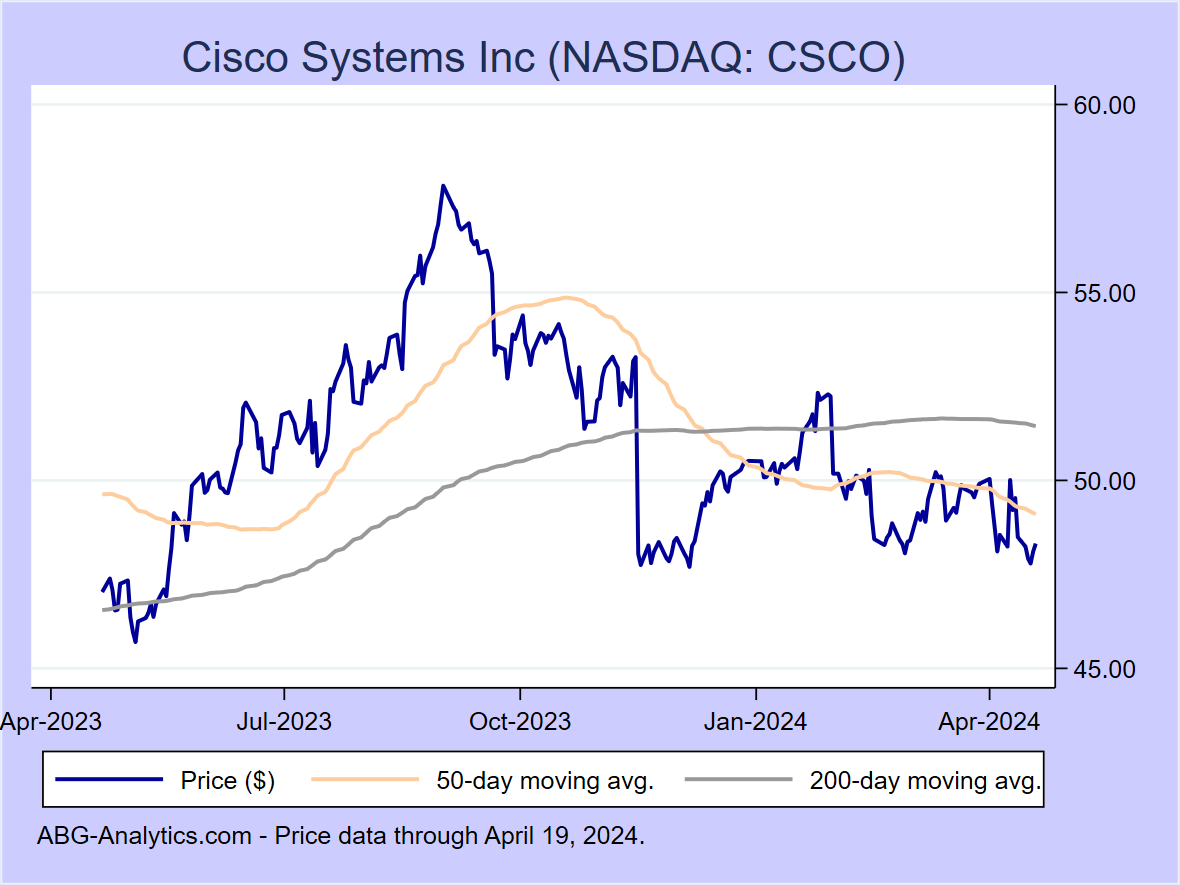
Cisco Systems Inc (NASDAQ:CSCO)
12-month return: -3.2%
12-month return: -3.2%
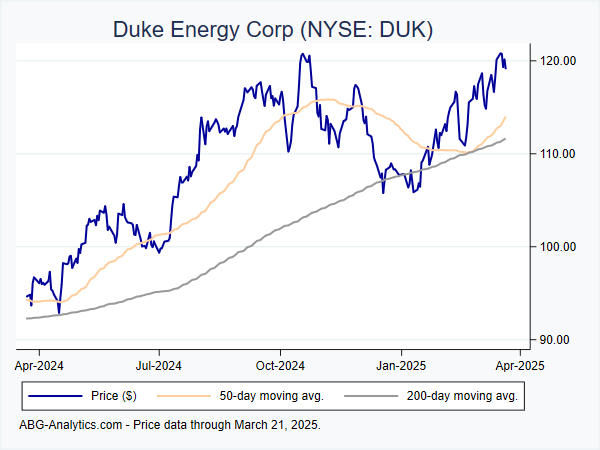
Duke Energy Corp (NYSE:DUK)
12-month return: -4.5%
12-month return: -4.5%
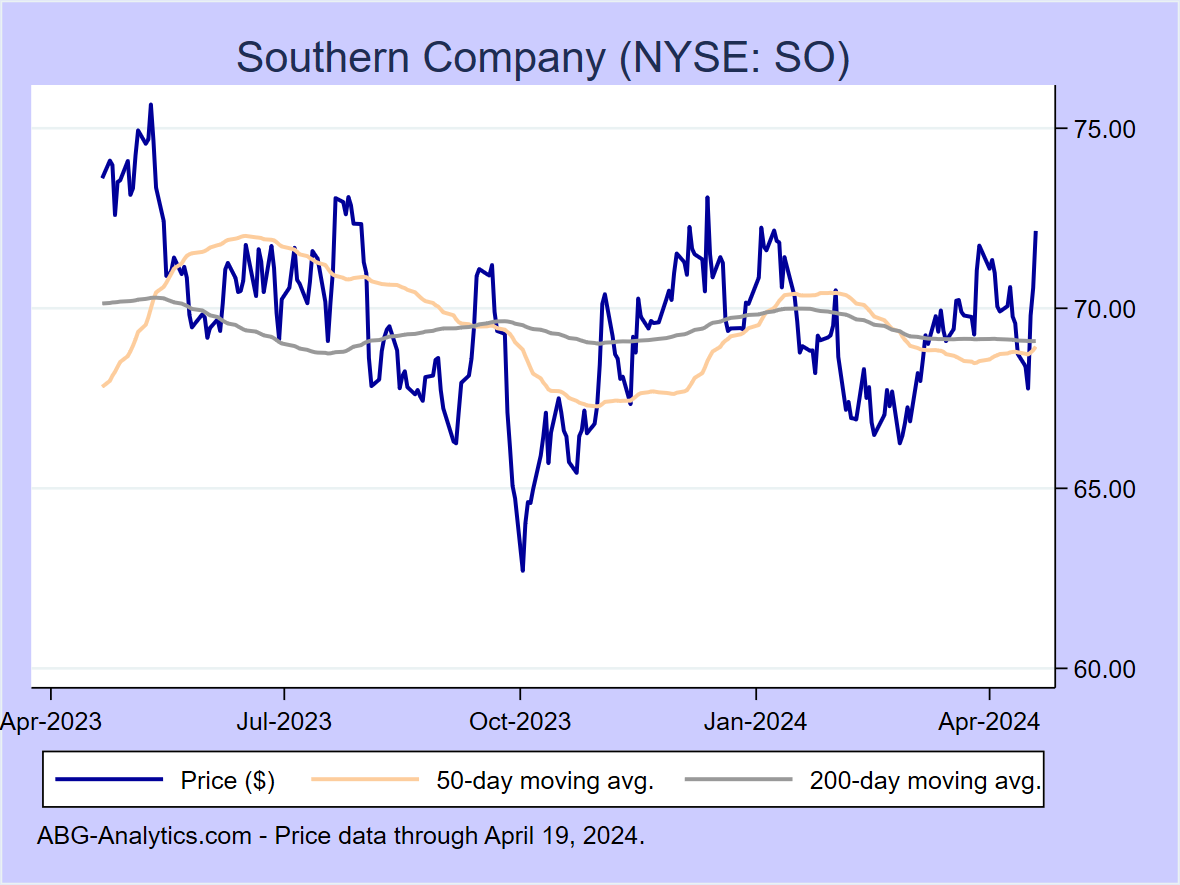
Southern Company (NYSE:SO)
12-month return: -4.7%
12-month return: -4.7%
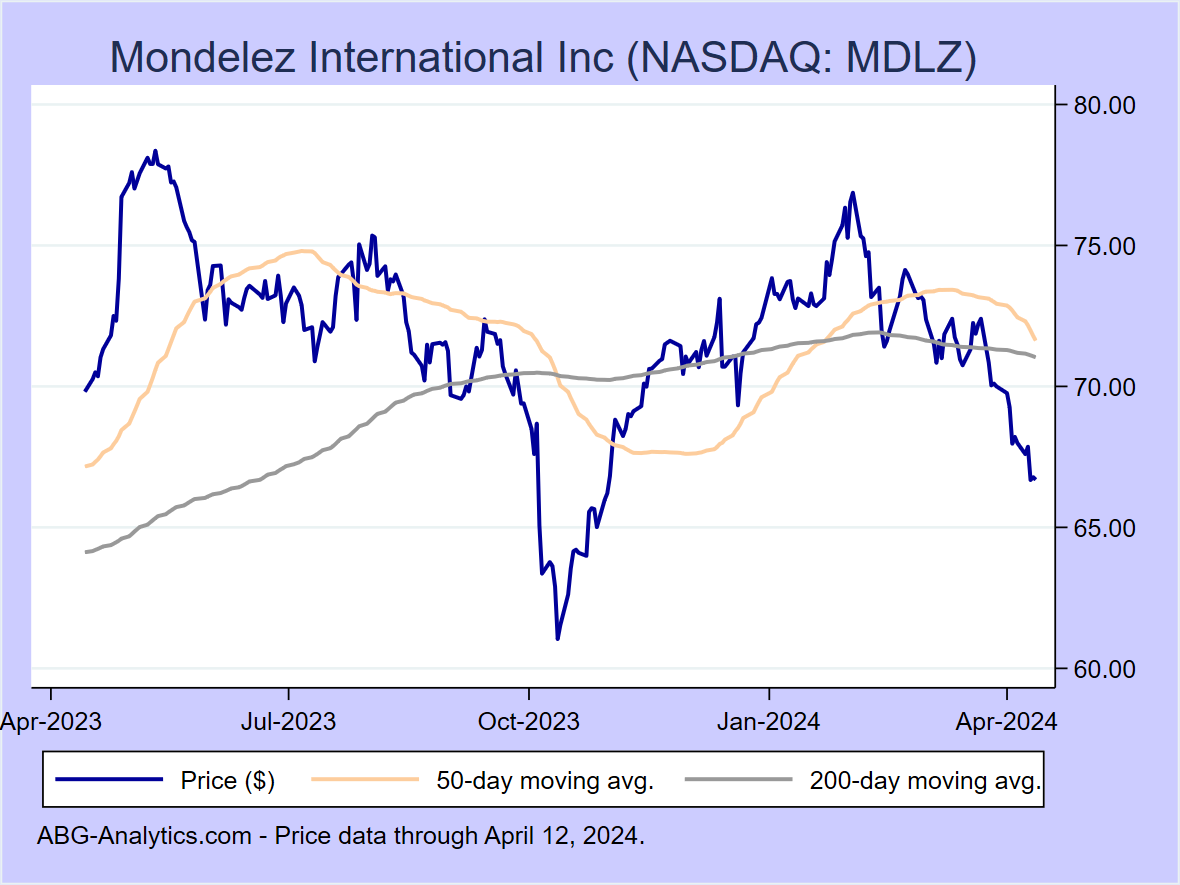
Mondelez International Inc (NASDAQ:MDLZ)
12-month return: -5.0%
12-month return: -5.0%
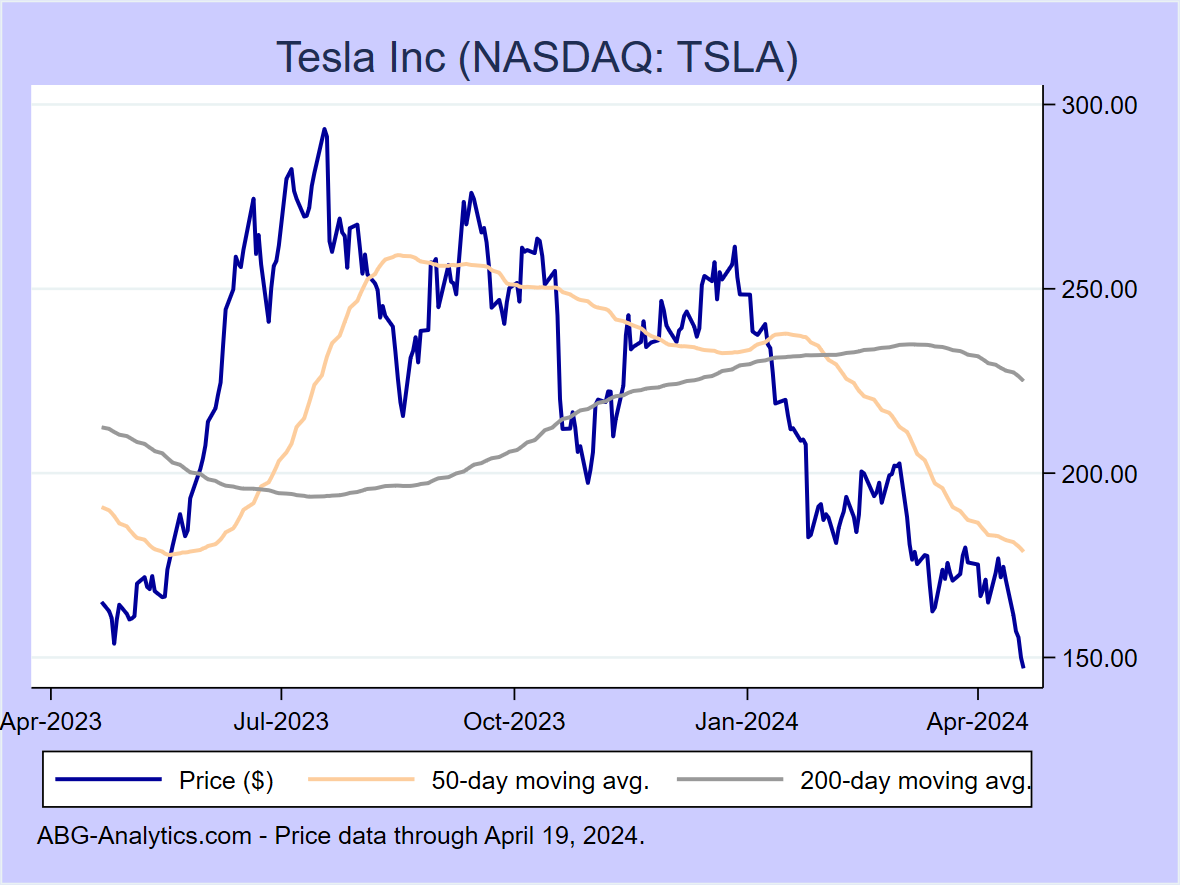
Tesla Inc (NASDAQ:TSLA)
12-month return: -5.3%
12-month return: -5.3%
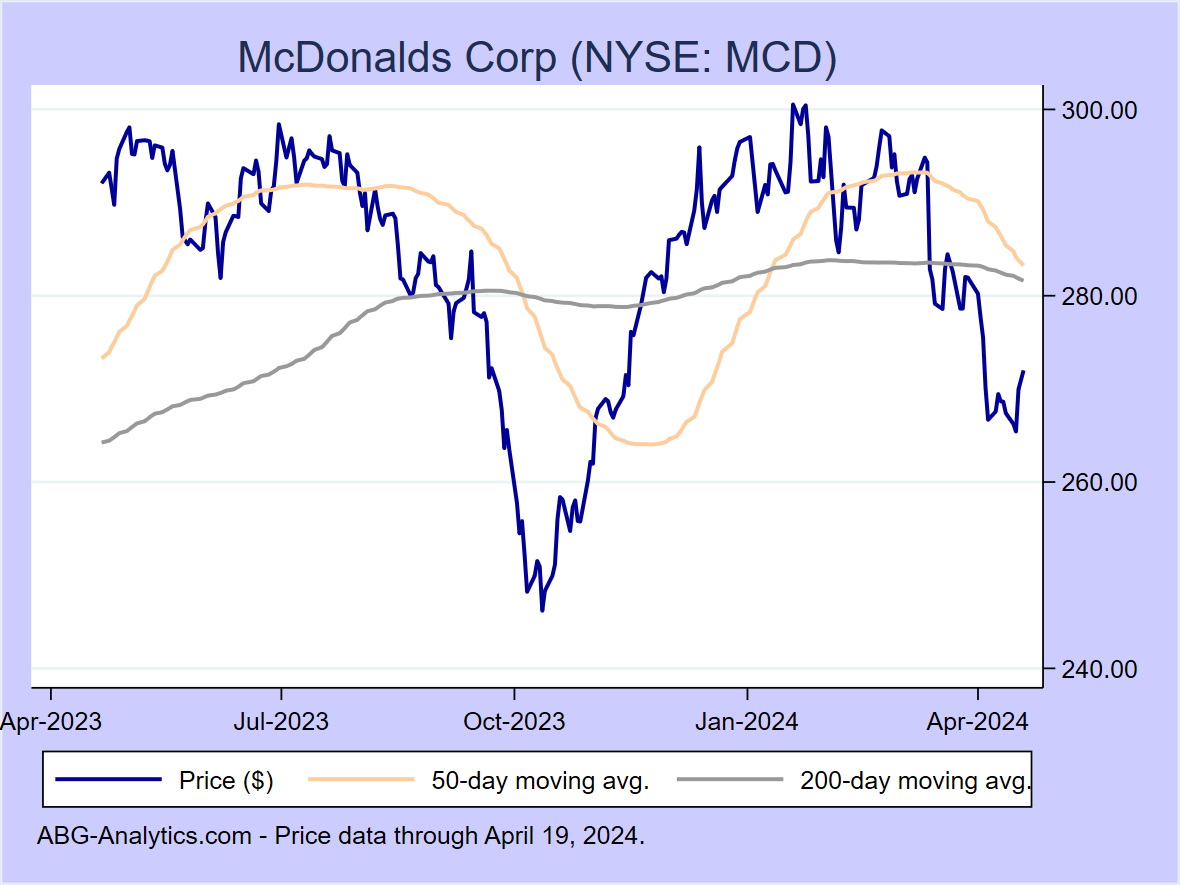
McDonalds Corp (NYSE:MCD)
12-month return: -6.3%
12-month return: -6.3%
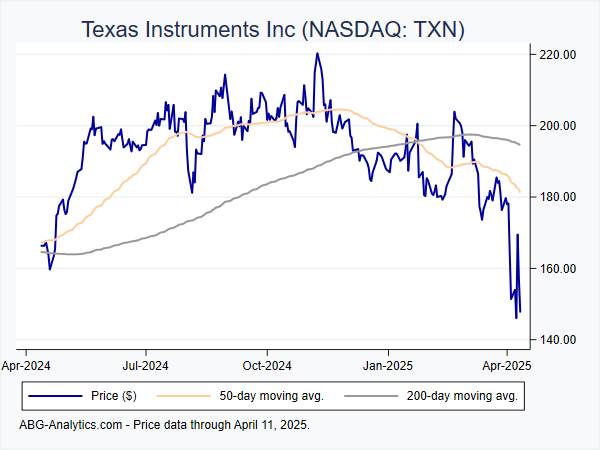
Texas Instruments Inc (NASDAQ:TXN)
12-month return: -6.3%
12-month return: -6.3%
Chevron Corp (NYSE:CVX)
12-month return: -6.4%
12-month return: -6.4%

Coca-Cola Co (NYSE:KO)
12-month return: -7.0%
12-month return: -7.0%
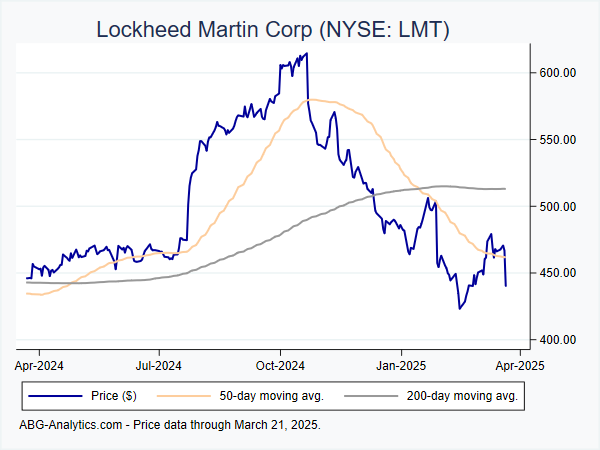
Lockheed Martin Corp (NYSE:LMT)
12-month return: -7.7%
12-month return: -7.7%
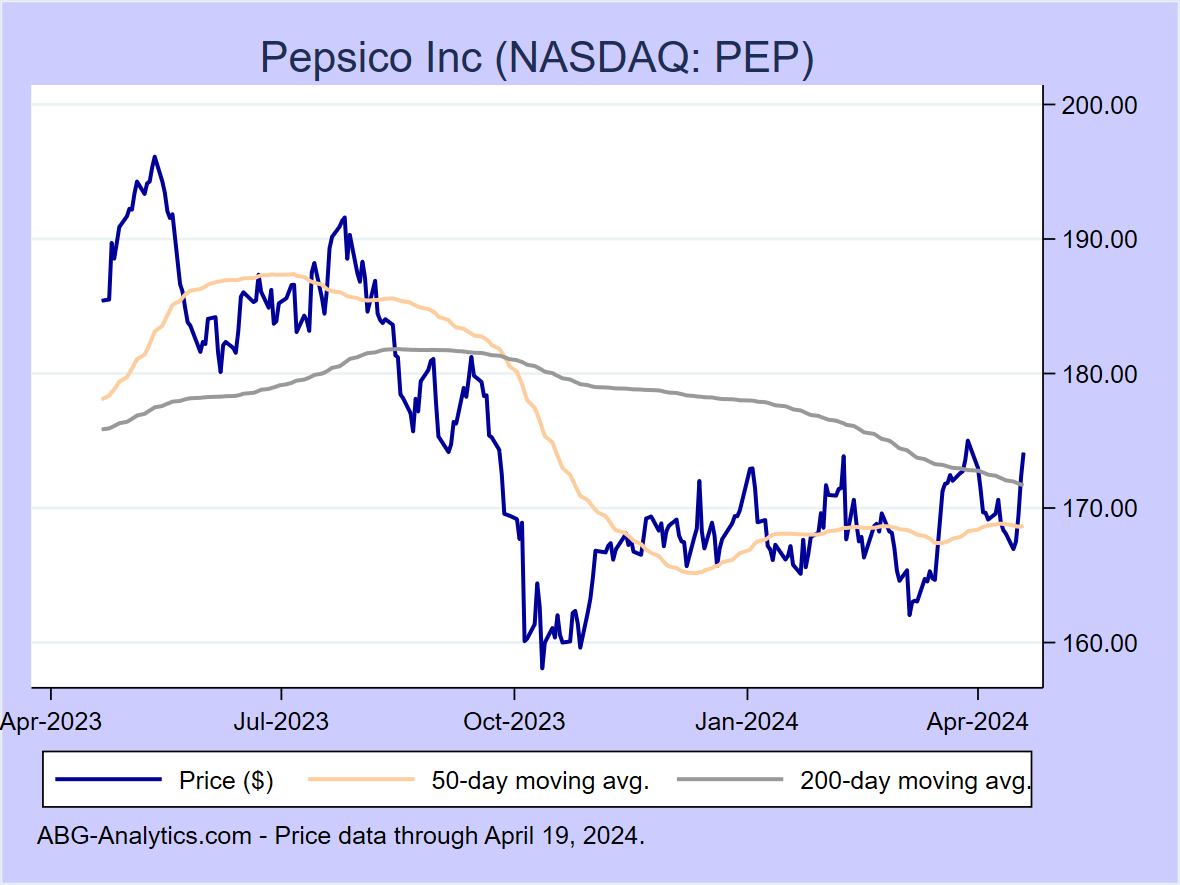
Pepsico Inc (NASDAQ:PEP)
12-month return: -7.9%
12-month return: -7.9%
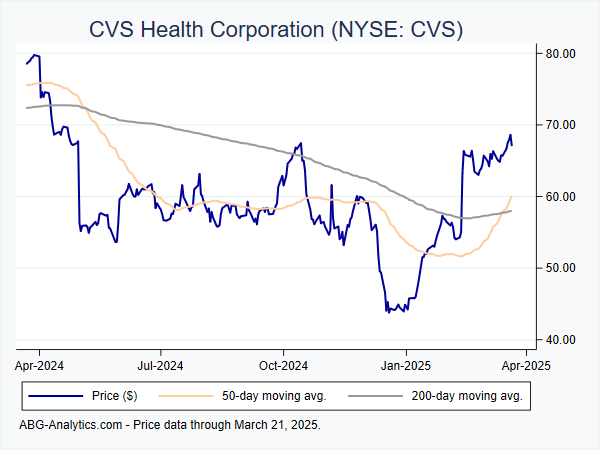
CVS Health Corporation (NYSE:CVS)
12-month return: -8.4%
12-month return: -8.4%
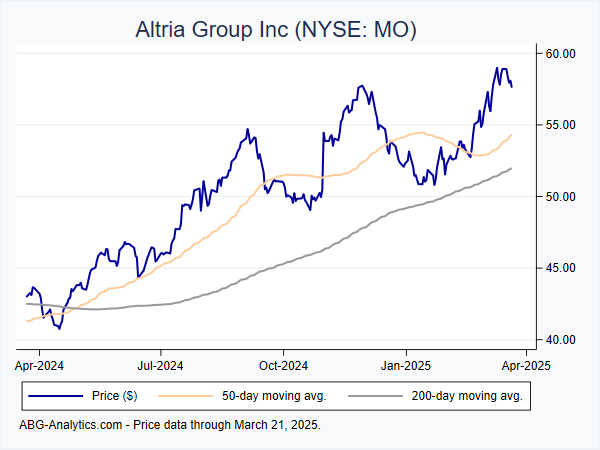
Altria Group Inc (NYSE:MO)
12-month return: -8.4%
12-month return: -8.4%
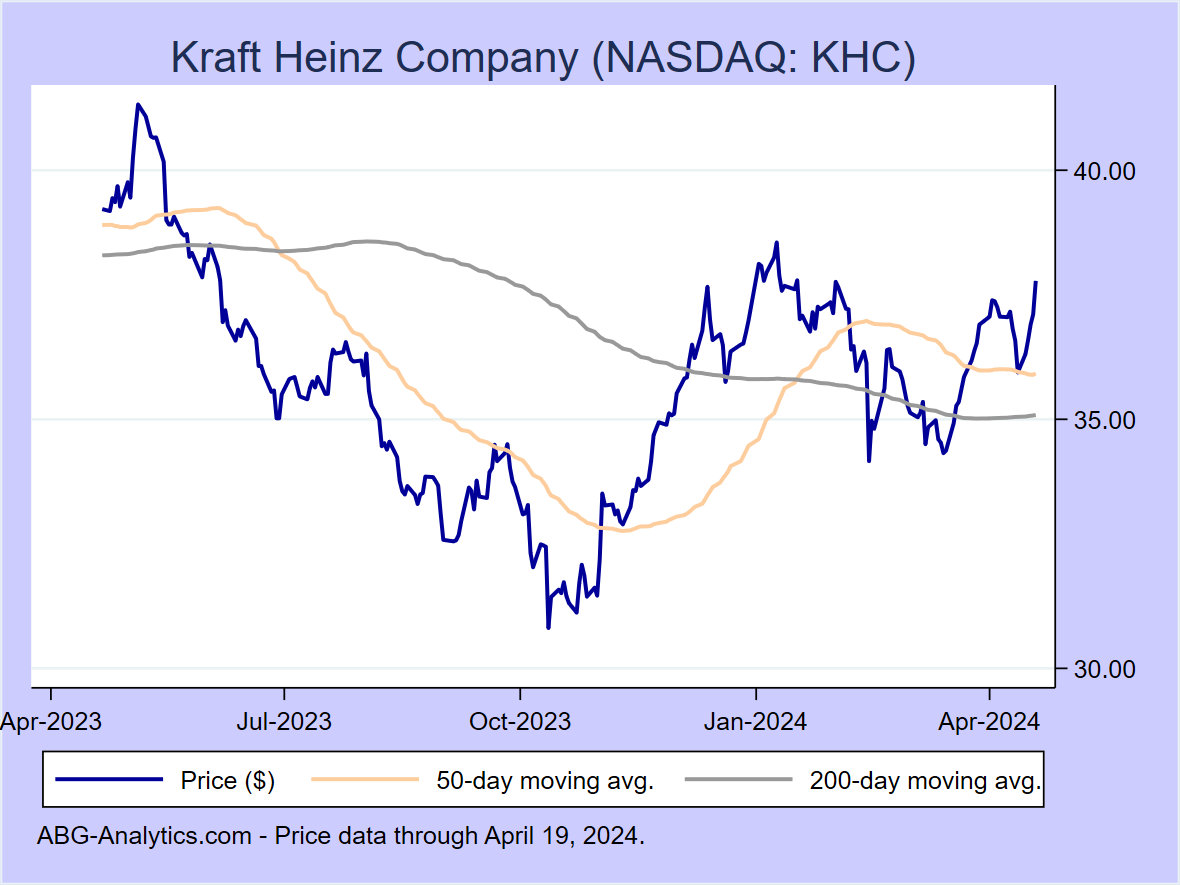
Kraft Heinz Company (NASDAQ:KHC)
12-month return: -8.5%
12-month return: -8.5%
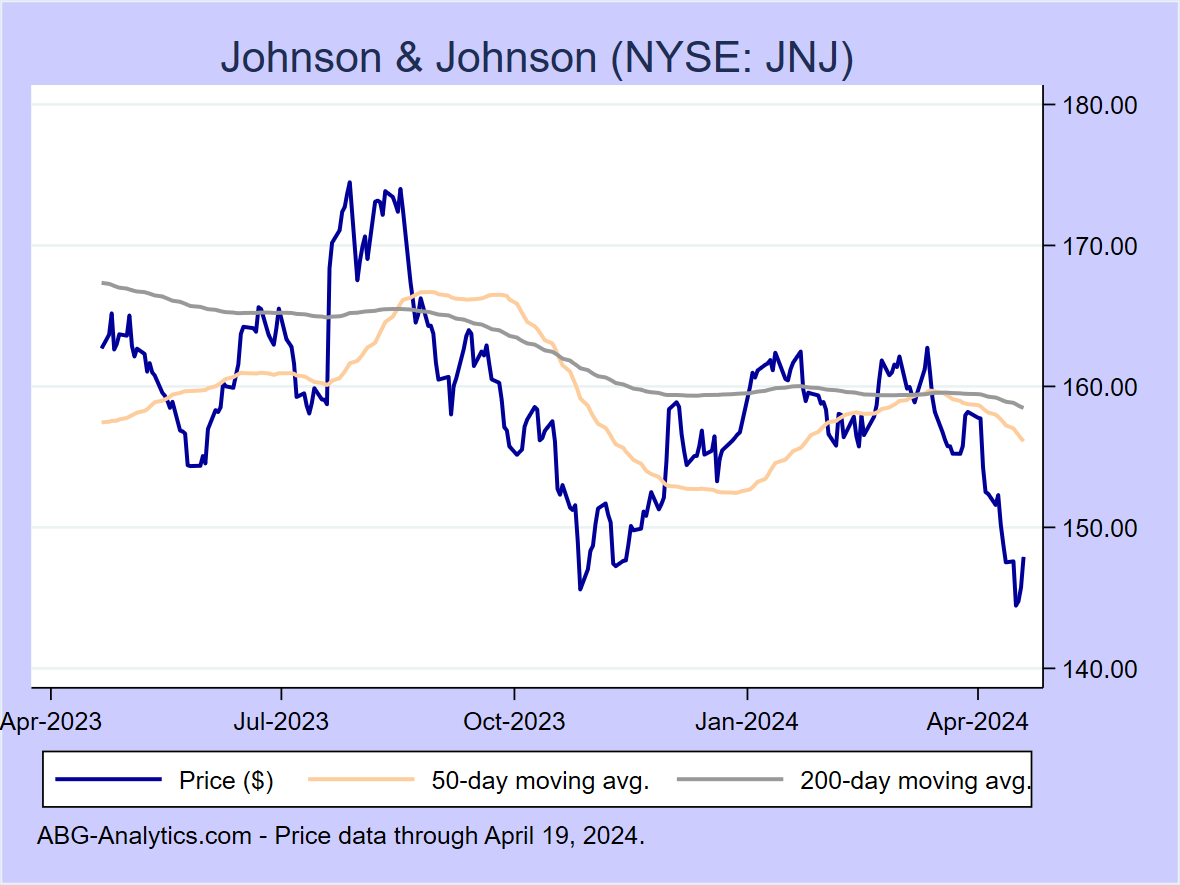
Johnson & Johnson (NYSE:JNJ)
12-month return: -10.0%
12-month return: -10.0%
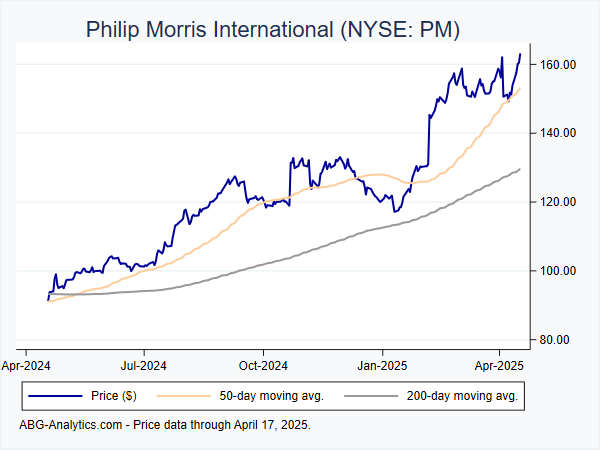
Philip Morris International (NYSE:PM)
12-month return: -10.1%
12-month return: -10.1%
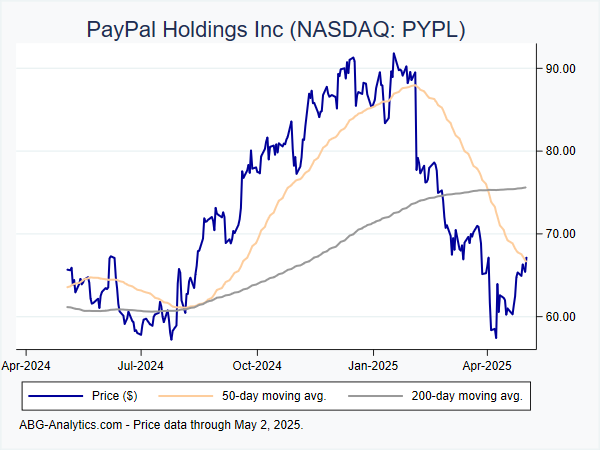
PayPal Holdings Inc (NASDAQ:PYPL)
12-month return: -12.1%
12-month return: -12.1%
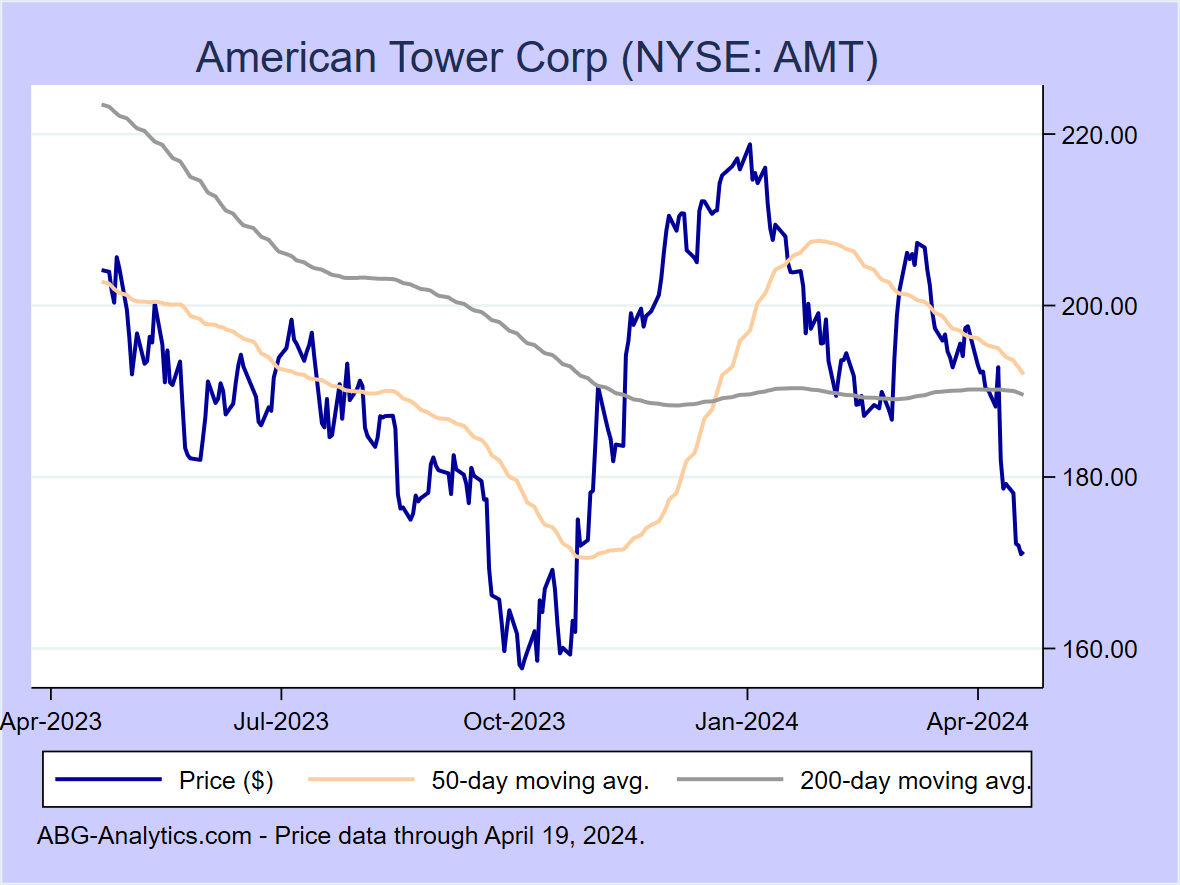
American Tower Corp (NYSE:AMT)
12-month return: -15.2%
12-month return: -15.2%
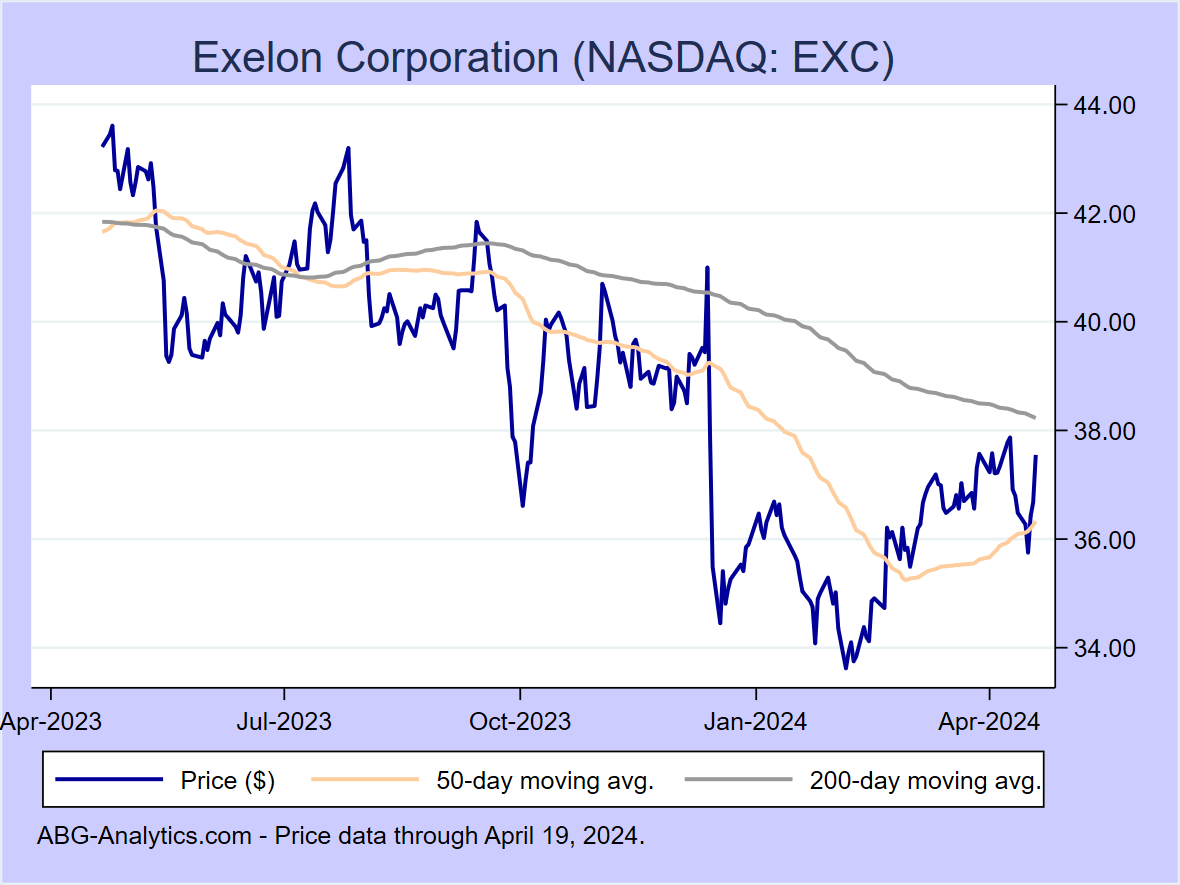
Exelon Corporation (NASDAQ:EXC)
12-month return: -15.3%
12-month return: -15.3%
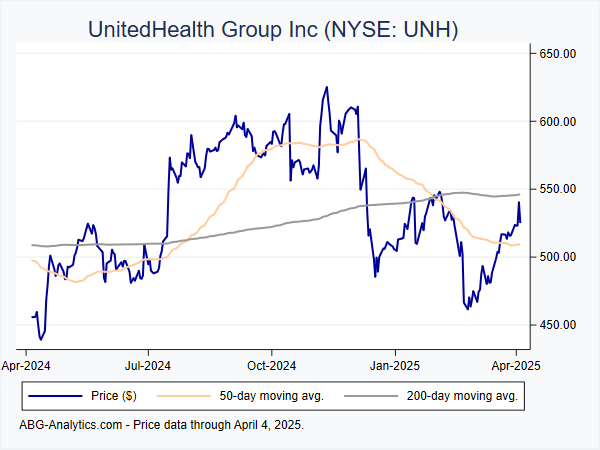
UnitedHealth Group Inc (NYSE:UNH)
12-month return: -15.7%
12-month return: -15.7%
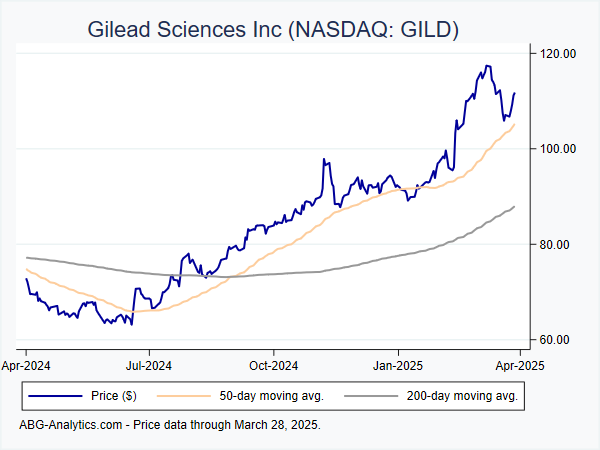
Gilead Sciences Inc (NASDAQ:GILD)
12-month return: -17.1%
12-month return: -17.1%

AT&T Inc (NYSE:T)
12-month return: -17.5%
12-month return: -17.5%
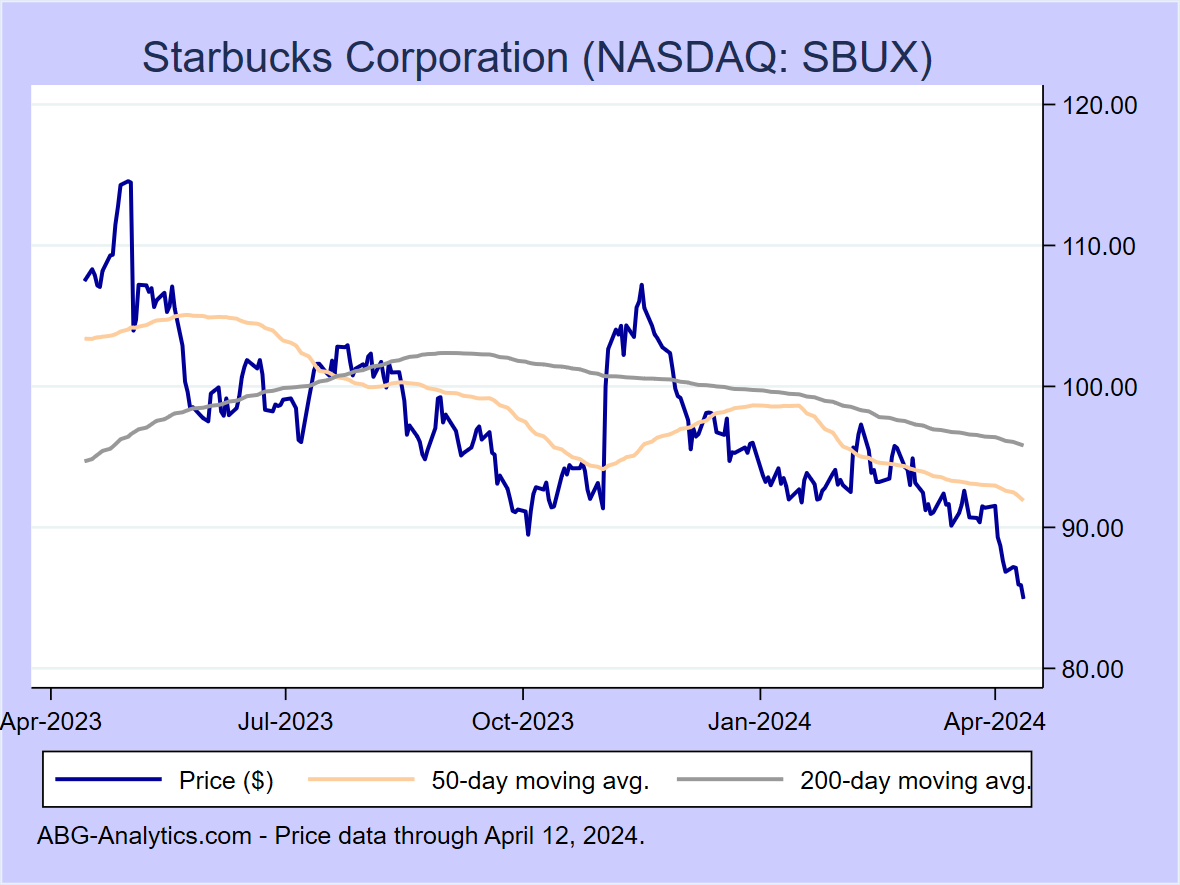
Starbucks Corporation (NASDAQ:SBUX)
12-month return: -19.6%
12-month return: -19.6%
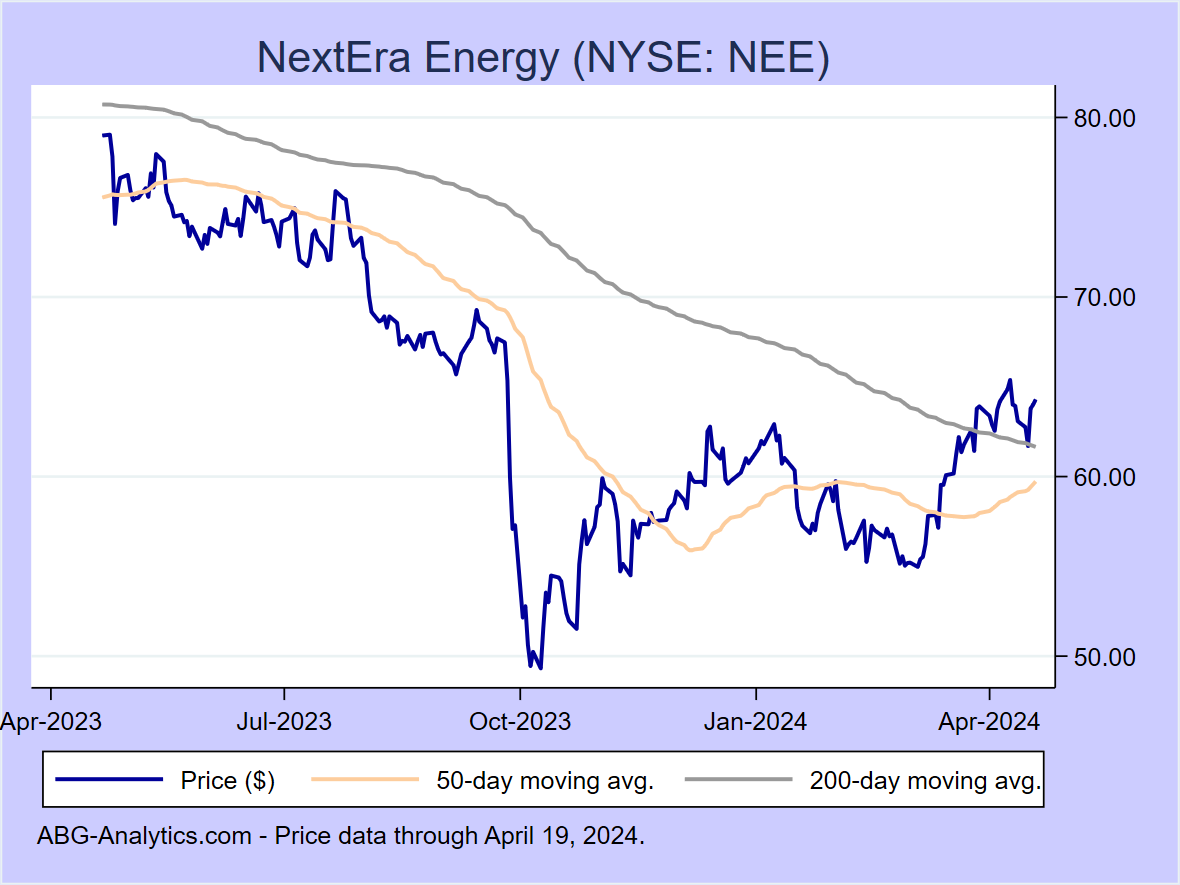
NextEra Energy (NYSE:NEE)
12-month return: -19.7%
12-month return: -19.7%
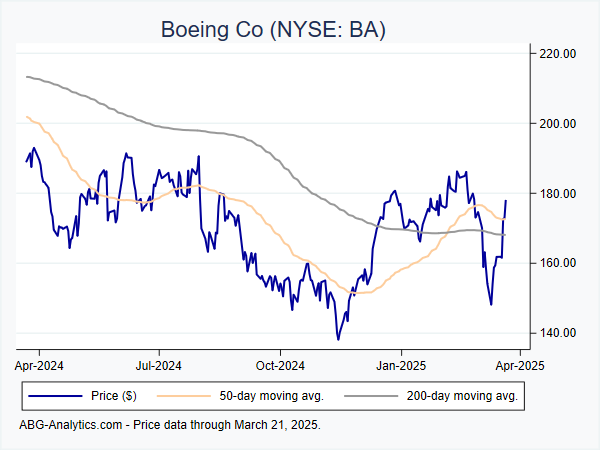
Boeing Co (NYSE:BA)
12-month return: -20.2%
12-month return: -20.2%
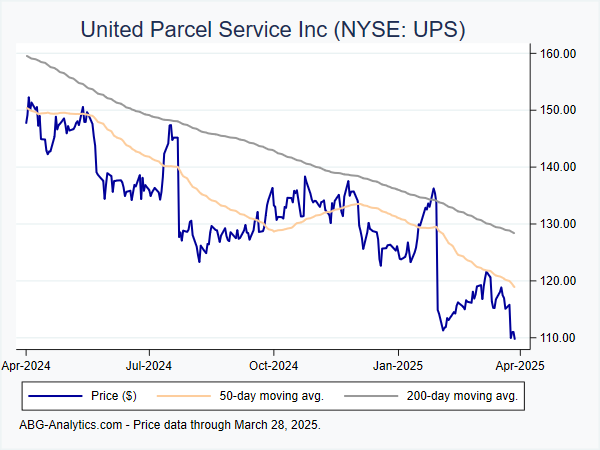
United Parcel Service Inc (NYSE:UPS)
12-month return: -23.7%
12-month return: -23.7%
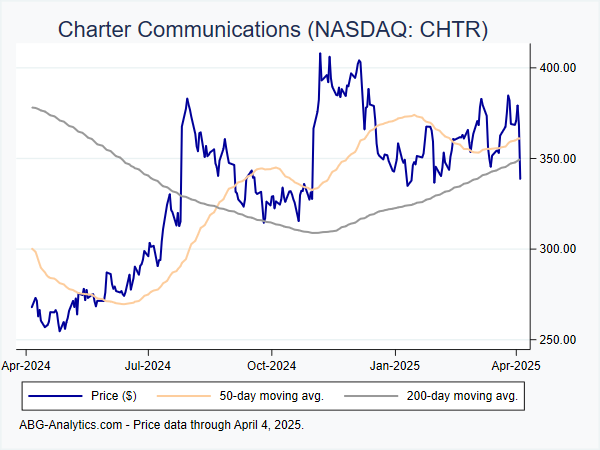
Charter Communications (NASDAQ:CHTR)
12-month return: -24.1%
12-month return: -24.1%
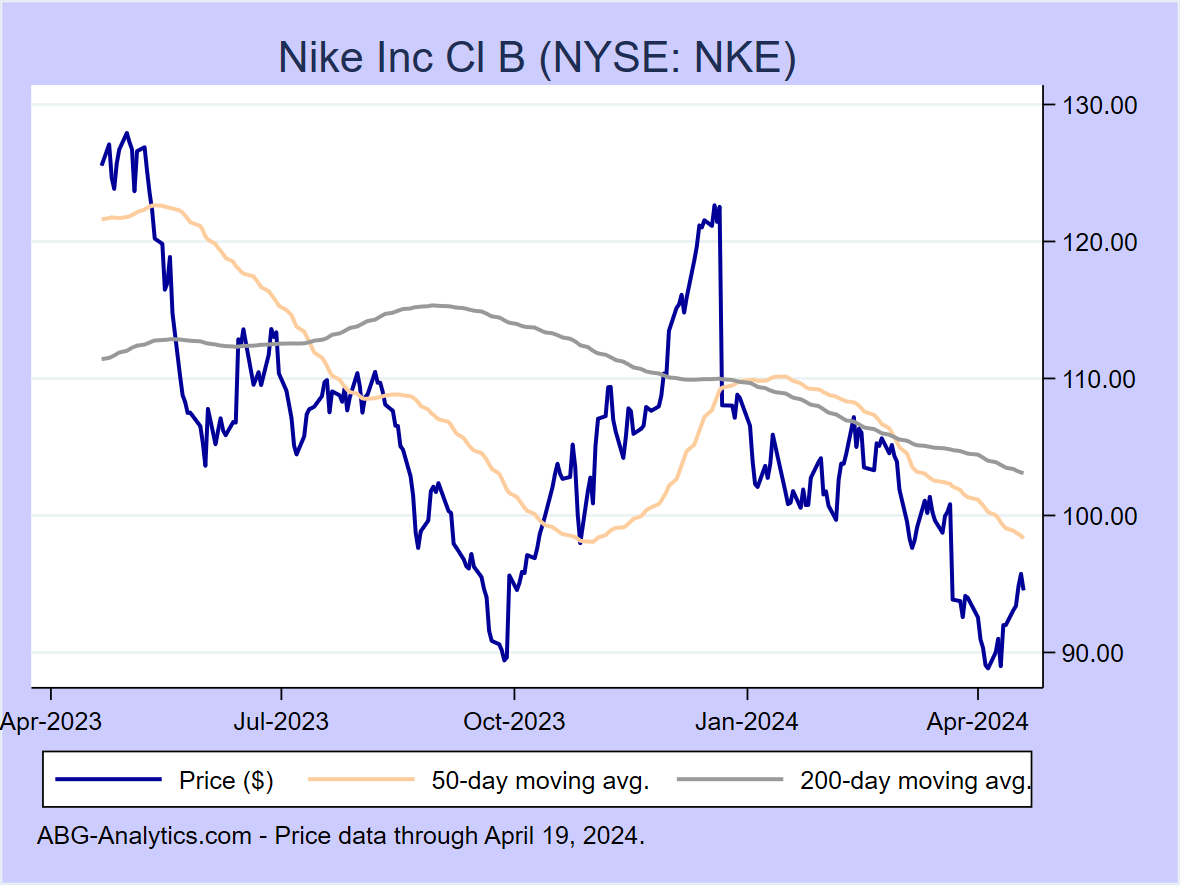
Nike Inc Cl B (NYSE:NKE)
12-month return: -25.6%
12-month return: -25.6%
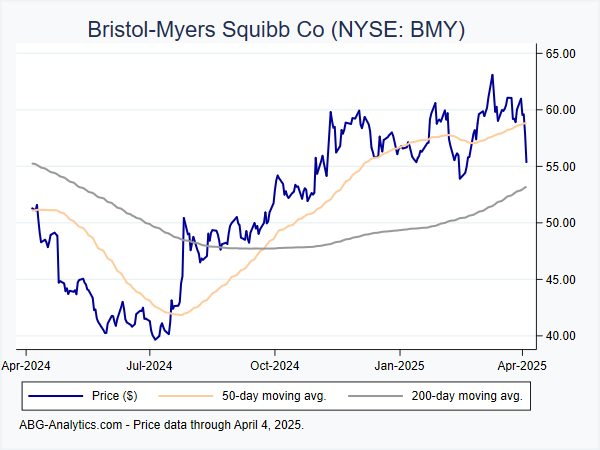
Bristol-Myers Squibb Co (NYSE:BMY)
12-month return: -31.2%
12-month return: -31.2%
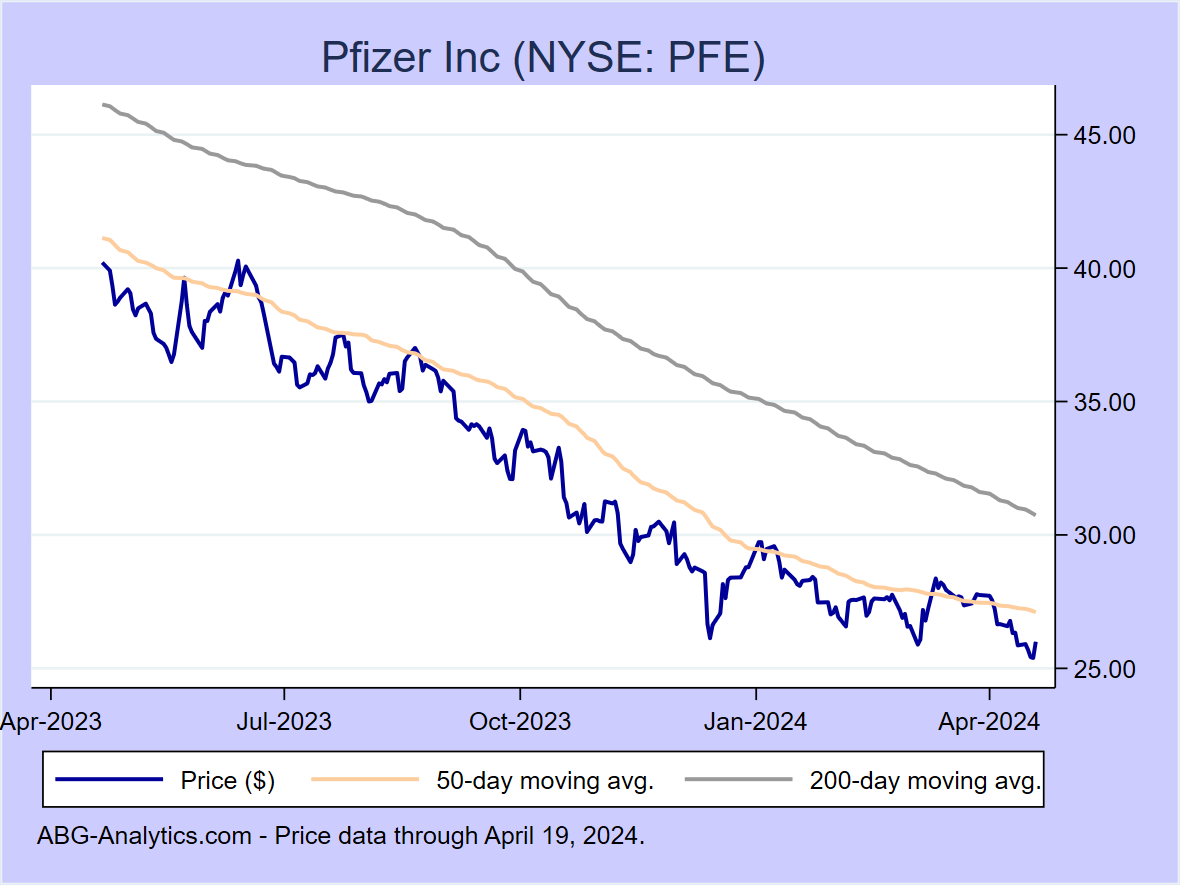
Pfizer Inc (NYSE:PFE)
12-month return: -37.5%
12-month return: -37.5%
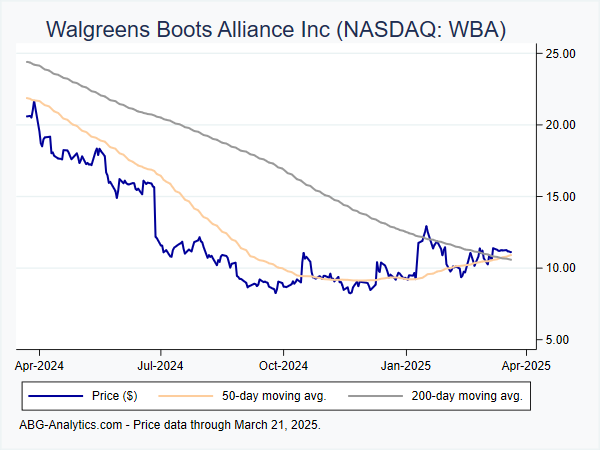
Walgreens Boots Alliance Inc (NASDAQ:WBA)
12-month return: -50.0%
12-month return: -50.0%