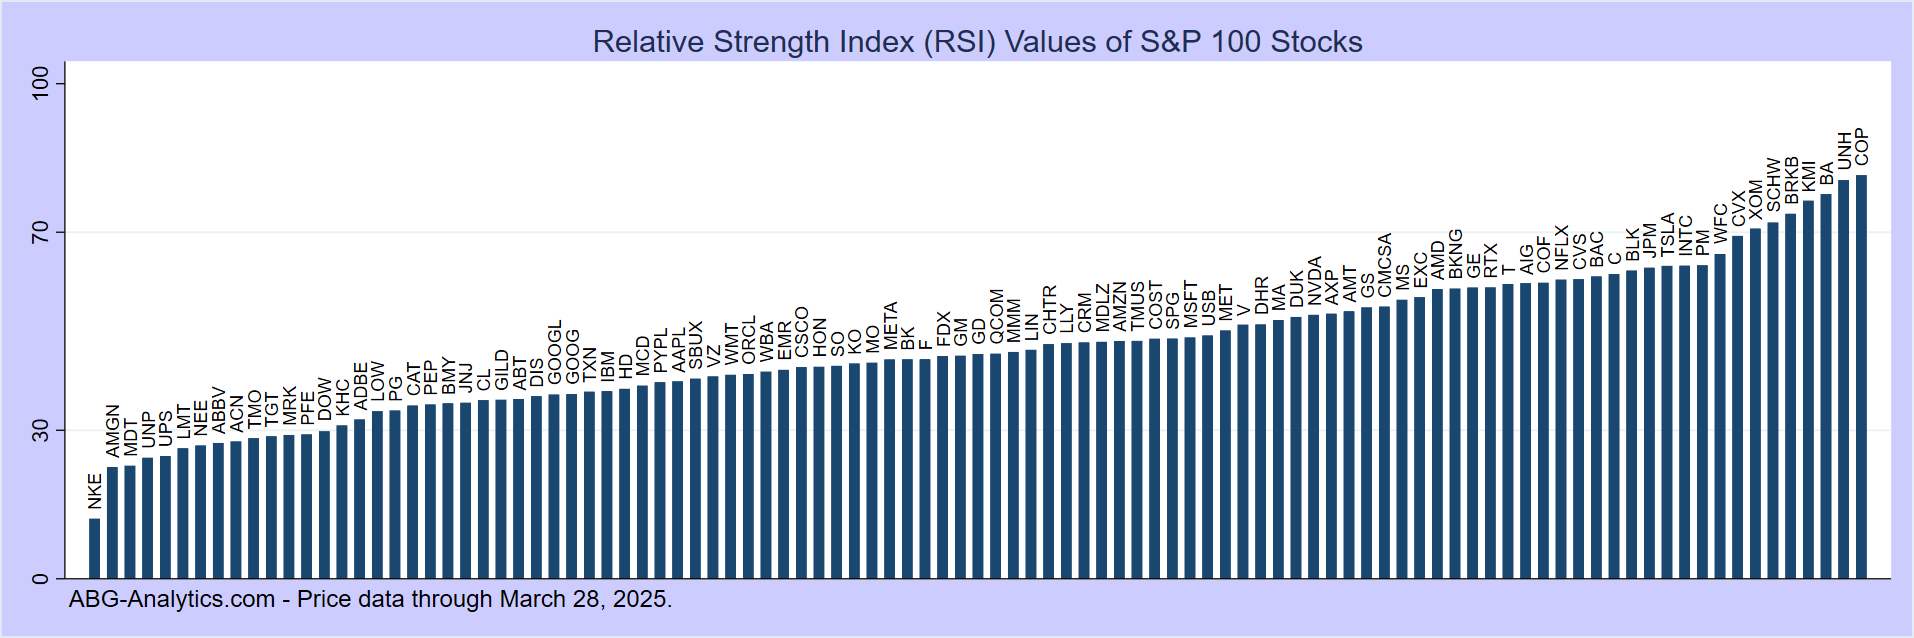
Oversold and Overbought Large-Cap Stocks
Stocks that move too far too fast in one direction have a slight tendency to experience short-term price reversals. The following tables list S&P-100 stocks that are oversold or overbought as measured by the 14-day Relative Strength Index (RSI). Stocks with RSI above 70 are considered overbought and more likely to experience a short-term price decline, while stocks with RSI below 30 are considered oversold and more likely to rebound in the short term. Here are this week's lists of low-RSI and high-RSI stocks:Oversold Stocks as of 03/13/2026
| Ticker - Company | Closing Price | 50-Day Moving Avg. | 200-Day Moving Avg. | RSI (14-Day) |
| AAPL - Apple Inc | 250.12 | 262.71 | 245.58 | 30% |
| ABT - Abbott Laboratories | 108.03 | 114.89 | 126.30 | 29% |
| BAC - Bank Of America Corp | 46.72 | 52.64 | 50.61 | 29% |
| BLK - Blackrock Incorporated | 924.11 | 1074.16 | 1084.90 | 18% |
| CL - Colgate-Palmolive Co | 88.84 | 89.65 | 84.78 | 28% |
| DHR - Danaher Corp | 187.32 | 219.03 | 210.25 | 18% |
| DIS - Walt Disney Company | 99.29 | 107.91 | 112.79 | 26% |
| F - Ford Motor Co | 11.67 | 13.54 | 12.33 | 25% |
| FDX - Fedex Corp | 351.68 | 344.55 | 268.15 | 23% |
| GE - GE Aerospace | 299.69 | 319.81 | 290.55 | 26% |
| GM - General Motors Company | 72.39 | 80.78 | 65.78 | 27% |
| GS - Goldman Sachs Group Inc | 782.21 | 909.59 | 793.83 | 25% |
| HD - Home Depot Inc | 339.03 | 372.25 | 376.09 | 25% |
| KHC - Kraft Heinz Company | 22.58 | 23.91 | 25.53 | 26% |
| KO - Coca-Cola Co | 77.34 | 75.44 | 70.99 | 28% |
| LOW - Lowes Companies Inc | 237.59 | 266.87 | 246.46 | 15% |
| MDLZ - Mondelez International Inc | 54.89 | 57.98 | 61.02 | 27% |
| MDT - Medtronic PLC | 87.14 | 97.88 | 94.38 | 12% |
| MET - Metlife Inc | 67.97 | 76.31 | 78.28 | 21% |
| MMM - 3M Company | 150.96 | 162.59 | 158.40 | 26% |
| NKE - Nike Inc Cl B | 53.98 | 62.53 | 67.21 | 13% |
| PG - Procter & Gamble Co | 150.65 | 152.93 | 153.37 | 24% |
| SPG - Simon Property Group | 186.82 | 192.00 | 178.86 | 23% |
| TMO - Thermo Fischer Scientific Inc | 464.37 | 558.78 | 513.17 | 25% |
| TXN - Texas Instruments Inc | 190.78 | 204.49 | 190.23 | 16% |
| UNP - Union Pacific Corp | 242.44 | 245.96 | 231.29 | 21% |
| UPS - United Parcel Service Inc | 97.21 | 109.53 | 97.24 | 16% |
| USB - US Bancorp | 51.00 | 55.76 | 49.62 | 27% |
| WFC - Wells Fargo & Company | 74.10 | 87.99 | 83.98 | 23% |
Note: RSI = Wilder's Relative Strength Index. Oversold = (RSI < 30).
Overbought Stocks as of 03/13/2026
| Ticker - Company | Closing Price | 50-Day Moving Avg. | 200-Day Moving Avg. | RSI (14-Day) |
| COP - ConocoPhillips | 121.89 | 106.20 | 95.64 | 74% |
| CVX - Chevron Corp | 196.82 | 176.51 | 158.06 | 71% |
| DOW - Dow Inc | 36.62 | 29.91 | 25.96 | 75% |
| DUK - Duke Energy Corp | 133.15 | 123.69 | 121.61 | 72% |
| IBM - International Business Machines Corp | 246.28 | 277.29 | 279.32 | 71% |
| NFLX - Netflix Inc | 95.31 | 86.97 | 109.09 | 83% |
Notes:
Note: RSI = Wilder's Relative Strength Index. Overbought = (RSI > 70).