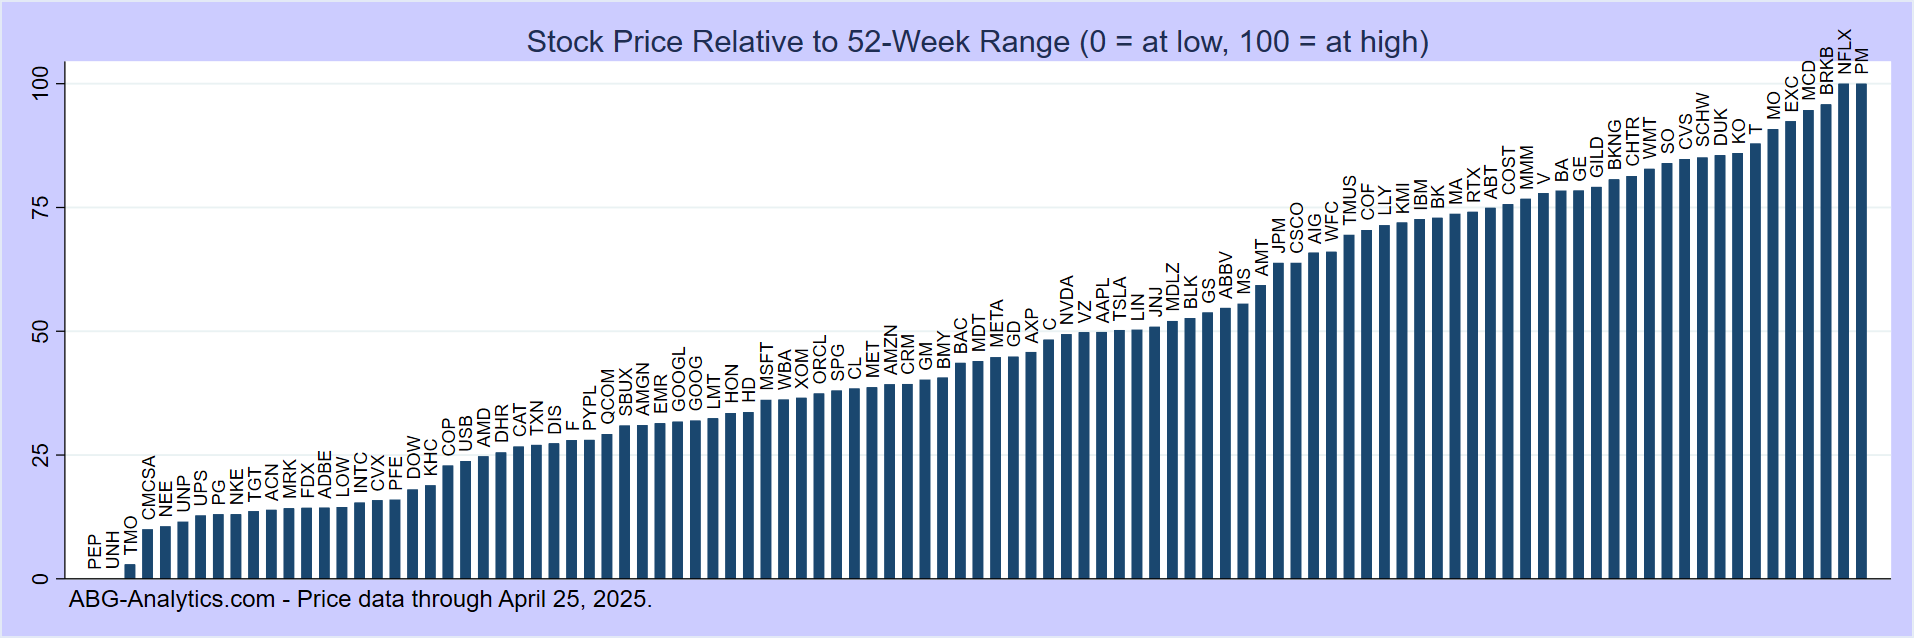
Stocks Trading Near 52-Week Highs and Lows

Momentum trading strategies often involve the buying of stocks that are trading at or near their 52-week high in the expectation that the stock will continue to reach new highs. See study 52-Week High and Momentum Investing for evidence on the effectiveness of this trading strategy. Contrarian trading strategies, on the other hand, can involve buying stocks at or near 52-week lows in anticipation that a bottom may be near, but this strategy can be quite risky, as such stocks tend to be highly volatile in either direction. Short selling stocks at 52-week lows may be quite profitable, but is also dangerous, as stocks will frequently bounce higher after hitting 52-week lows, even if they are headed far lower in the longer term.

Stocks Near 52-Week Highs

(as of market close 12/05/2025)
Ticker - Company Closing Price 52-Week Low 52-Week High Price Relative to 52 Week Range (0 to 100%)
Apple Inc (NASDAQ:AAPL)$278.78 $172.42$286.19 95%
American Express Co (NYSE:AXP)$370.35 $231.39$372.77 99%
Bank Of America Corp (NYSE:BAC)$53.95 $34.39$54.16 99%
Bank of New York Mellon Corporation (NYSE:BK)$114.02 $73.31$114.02100%
Citigroup (NYSE:C)$108.88 $58.13$108.88100%
Caterpillar Inc (NYSE:CAT)$603.17 $273.94$603.17100%
Capital One Financial Cp (NYSE:COF)$230.68 $150.57$230.68100%
Cisco Systems Inc (NASDAQ:CSCO)$77.97 $53.19$78.39 99%
General Motors Company (NYSE:GM)$76.05 $42.48$76.05100%
Alphabet Inc (NASDAQ:GOOG)$322.09 $146.58$323.64 99%
Alphabet Inc Class A (NASDAQ:GOOGL)$321.27 $144.70$323.44 99%
Goldman Sachs Group Inc (NYSE:GS)$854.56 $462.22$854.56100%
International Business Machines Corp (NYSE:IBM)$307.94 $217.40$314.98 94%
Johnson & Johnson (NYSE:JNJ)$201.93 $142.06$207.56 93%
JPMorgan Chase and Co (NYSE:JPM)$315.04 $210.28$320.41 96%
Morgan Stanley (NYSE:MS)$176.51 $99.83$176.51100%
Simon Property Group (NYSE:SPG)$182.56 $140.37$187.78 90%
US Bancorp (NYSE:USB)$51.26 $36.40$52.18 95%
Wells Fargo & Company (NYSE:WFC)$89.83 $60.98$90.21 99%
Walmart Inc (NYSE:WMT)$115.11 $81.79$115.11100%

Stocks Near 52-Week Lows

(as of market close 12/05/2025)
Ticker - Company Closing Price 52-Week Low 52-Week High Price Relative to 52 Week Range (0 to 100%)
Costco Wholesale Corp (NASDAQ:COST)$894.68 $886.12$1076.86 5%
Kraft Heinz Company (NASDAQ:KHC)$24.34 $23.72$32.22 8%
Linde plc (NASDAQ:LIN)$399.57 $399.57$483.59 0%
Mondelez International Inc (NASDAQ:MDLZ)$54.90 $54.90$70.75 0%
Procter & Gamble Co (NYSE:PG)$143.45 $143.45$176.26 0%

Bar Chart of Stock Price Relative to 52-Week Range

52-Week Highs and Lows, and Price Relative to 52-Week Range, of all S&P-100 Stocks

(as of market close 12/05/2025)
Ticker - Company Closing Price 52-Week Low 52-Week High Price Relative to 52 Week Range (0 to 100%)
Apple Inc (NASDAQ:AAPL)$278.78 $172.42$286.19 95%
AbbVie Inc (NYSE:ABBV)$226.08 $169.20$244.38 79%
Abbott Laboratories (NYSE:ABT)$125.08 $111.10$140.22 51%
Accenture Ltd (NYSE:ACN)$266.59 $232.56$398.25 25%
Adobe Systems Inc (NASDAQ:ADBE)$346.26 $312.40$552.96 18%
American International Group (NYSE:AIG)$77.03 $70.00$87.72 42%
Advanced Micro Devices (NASDAQ:AMD)$217.97 $78.21$264.33 84%
Amgen Inc (NASDAQ:AMGN)$329.89 $258.59$345.46 84%
American Tower Corp (NYSE:AMT)$178.86 $173.46$232.35 10%
Amazon.Com Inc (NASDAQ:AMZN)$229.53 $167.32$254.00 76%
American Express Co (NYSE:AXP)$370.35 $231.39$372.77 99%
Boeing Co (NYSE:BA)$201.89 $136.59$237.38 71%
Bank Of America Corp (NYSE:BAC)$53.95 $34.39$54.16 99%
Bank of New York Mellon Corporation (NYSE:BK)$114.02 $73.31$114.02100%
Booking Holdings, Inc (NASDAQ:BKNG)$5197.04 $4164.15$5815.92 66%
Blackrock Incorporated (NYSE:BLK)$1072.16 $815.72$1202.59 70%
Bristol-Myers Squibb Co (NYSE:BMY)$52.15 $42.60$63.11 51%
Berkshire Hathaway Cl B (NYSE:BRKB)$504.34 $442.66$539.80 66%
Citigroup (NYSE:C)$108.88 $58.13$108.88100%
Caterpillar Inc (NYSE:CAT)$603.17 $273.94$603.17100%
Charter Communications (NASDAQ:CHTR)$205.10 $194.22$427.25 7%
Colgate-Palmolive Co (NYSE:CL)$78.07 $74.98$97.50 15%
Comcast Corp Cl A (NASDAQ:CMCSA)$27.31 $26.46$43.15 6%
Capital One Financial Cp (NYSE:COF)$230.68 $150.57$230.68100%
ConocoPhillips (NYSE:COP)$93.69 $82.66$106.10 50%
Costco Wholesale Corp (NASDAQ:COST)$894.68 $886.12$1076.86 5%
Salesforce Inc (NYSE:CRM)$260.57 $225.37$361.99 31%
Cisco Systems Inc (NASDAQ:CSCO)$77.97 $53.19$78.39 99%
CVS Health Corporation (NYSE:CVS)$75.63 $43.78$83.04 85%
Chevron Corp (NYSE:CVX)$150.00 $133.73$168.51 50%
Danaher Corp (NYSE:DHR)$226.25 $174.64$250.59 72%
Walt Disney Company (NYSE:DIS)$105.30 $81.72$124.01 61%
Dow Inc (NYSE:DOW)$22.96 $20.65$42.73 15%
Duke Energy Corp (NYSE:DUK)$116.52 $105.76$129.03 49%
Emerson Electric Co (NYSE:EMR)$137.39 $94.15$149.63 82%
Exelon Corporation (NASDAQ:EXC)$43.81 $36.22$48.24 66%
Ford Motor Co (NYSE:F)$13.03 $ 8.69$13.84 87%
Fedex Corp (NYSE:FDX)$274.29 $198.07$283.69 91%
General Dynamics Corp (NYSE:GD)$337.31 $241.94$353.77 87%
GE Aerospace (NYSE:GE)$283.94 $159.95$314.28 85%
Gilead Sciences Inc (NASDAQ:GILD)$121.22 $89.14$128.07 85%
General Motors Company (NYSE:GM)$76.05 $42.48$76.05100%
Alphabet Inc (NASDAQ:GOOG)$322.09 $146.58$323.64 99%
Alphabet Inc Class A (NASDAQ:GOOGL)$321.27 $144.70$323.44 99%
Goldman Sachs Group Inc (NYSE:GS)$854.56 $462.22$854.56100%
Home Depot Inc (NYSE:HD)$354.61 $332.38$431.37 25%
Honeywell International (NASDAQ:HON)$191.33 $171.63$225.63 40%
International Business Machines Corp (NYSE:IBM)$307.94 $217.40$314.98 94%
Intel Corp (NASDAQ:INTC)$41.41 $18.13$43.76 94%
Johnson & Johnson (NYSE:JNJ)$201.93 $142.06$207.56 93%
JPMorgan Chase and Co (NYSE:JPM)$315.04 $210.28$320.41 96%
Kraft Heinz Company (NASDAQ:KHC)$24.34 $23.72$32.22 8%
Kinder Morgan Inc (NYSE:KMI)$27.77 $25.21$31.22 45%
Coca-Cola Co (NYSE:KO)$70.00 $60.81$73.90 72%
Linde plc (NASDAQ:LIN)$399.57 $399.57$483.59 0%
Eli Lilly & Company (NYSE:LLY)$1010.31 $625.65$1109.94 84%
Lockheed Martin Corp (NYSE:LMT)$452.20 $410.74$514.24 43%
Lowes Companies Inc (NYSE:LOW)$248.47 $210.83$274.15 63%
Mastercard Incorporated (NYSE:MA)$545.52 $479.92$598.96 58%
McDonalds Corp (NYSE:MCD)$311.23 $279.74$321.29 77%
Mondelez International Inc (NASDAQ:MDLZ)$54.90 $54.90$70.75 0%
Medtronic PLC (NYSE:MDT)$101.36 $79.61$105.35 86%
Metlife Inc (NYSE:MET)$78.66 $68.42$87.00 58%
Meta Platforms Inc (NASDAQ:META)$673.42 $484.66$790.00 67%
3M Company (NYSE:MMM)$167.48 $125.53$173.09 90%
Altria Group Inc (NYSE:MO)$57.99 $50.81$67.68 46%
Merck & Co (NYSE:MRK)$99.72 $73.47$105.66 84%
Morgan Stanley (NYSE:MS)$176.51 $99.83$176.51100%
Microsoft Corp (NASDAQ:MSFT)$483.16 $354.56$542.07 73%
NextEra Energy (NYSE:NEE)$83.13 $64.11$86.29 87%
Netflix Inc (NASDAQ:NFLX)$100.24 $82.84$133.91 40%
Nike Inc Cl B (NYSE:NKE)$65.86 $53.27$81.72 50%
NVIDIA Corporation (NASDAQ:NVDA)$182.41 $94.31$207.04 84%
Oracle Corp (NYSE:ORCL)$217.58 $122.82$328.33 58%
Pepsico Inc (NASDAQ:PEP)$145.02 $128.02$159.84 56%
Pfizer Inc (NYSE:PFE)$26.03 $21.59$27.37 79%
Procter & Gamble Co (NYSE:PG)$143.45 $143.45$176.26 0%
Philip Morris International (NYSE:PM)$147.81 $117.15$184.95 51%
PayPal Holdings Inc (NASDAQ:PYPL)$62.28 $57.41$91.81 17%
Qualcomm Inc (NASDAQ:QCOM)$174.81 $124.66$187.68 83%
RTX Corporation (NYSE:RTX)$171.10 $113.75$179.44 90%
Starbucks Corporation (NASDAQ:SBUX)$85.12 $78.46$115.81 21%
Charles Schwab Corp (NYSE:SCHW)$93.82 $69.06$98.69 86%
Southern Company (NYSE:SO)$86.28 $80.96$99.72 31%
Simon Property Group (NYSE:SPG)$182.56 $140.37$187.78 90%
AT&T Inc (NYSE:T)$25.28 $21.56$29.62 50%
Target Corporation (NYSE:TGT)$92.19 $83.68$142.50 18%
Thermo Fischer Scientific Inc (NYSE:TMO)$572.77 $390.26$606.74 87%
T-Mobile US Inc (NASDAQ:TMUS)$209.63 $201.01$272.83 14%
Tesla Inc (NASDAQ:TSLA)$455.00 $221.86$479.86 93%
Texas Instruments Inc (NASDAQ:TXN)$182.54 $145.61$221.25 54%
UnitedHealth Group Inc (NYSE:UNH)$330.91 $237.77$599.47 36%
Union Pacific Corp (NYSE:UNP)$235.31 $208.27$254.42 61%
United Parcel Service Inc (NYSE:UPS)$94.87 $82.58$136.26 28%
US Bancorp (NYSE:USB)$51.26 $36.40$52.18 95%
Visa Inc (NYSE:V)$331.24 $306.92$373.31 39%
Verizon Communications (NYSE:VZ)$41.69 $37.81$46.49 47%
Wells Fargo & Company (NYSE:WFC)$89.83 $60.98$90.21 99%
Walmart Inc (NYSE:WMT)$115.11 $81.79$115.11100%

Methods

  • Stocks are deemed to be near their 52-week high (low) if they are within 3 percent of the high (low) or they achieved a new high (low) within the 5 most recent market days.
  • Price relative to 52-week range is calculated as [log(price)-log(low price)]/[log(high price)-log(low price)]*100%. Thus a stock with a current price of $4 with a 52-week high of $8 and a 52-week low of $2 will have price relative to range of 50%.

Reference

George, Thomas J. and Chuan-Yang Hwang (2004). "The 52-Week High and Momentum Investing." The Journal of Finance. Volume LIX. Number 5. 2145-2176.