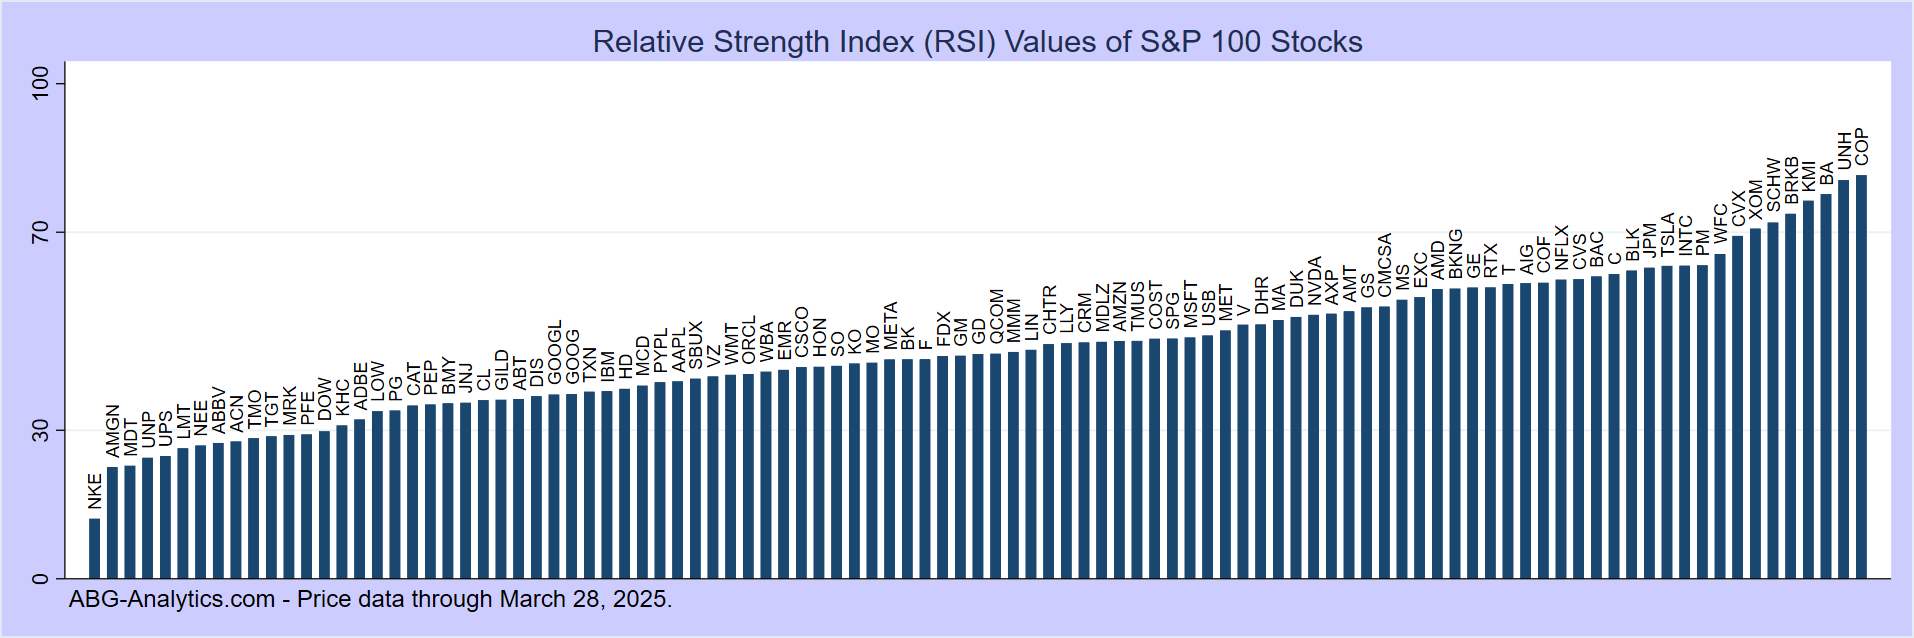
Oversold and Overbought Large-Cap Stocks
Stocks that move too far too fast in one direction have a slight tendency to experience short-term price reversals. The following tables list S&P-100 stocks that are oversold or overbought as measured by the 14-day Relative Strength Index (RSI). Stocks with RSI above 70 are considered overbought and more likely to experience a short-term price decline, while stocks with RSI below 30 are considered oversold and more likely to rebound in the short term. Here are this week's lists of low-RSI and high-RSI stocks:Oversold Stocks as of 02/27/2026
| Ticker - Company | Closing Price | 50-Day Moving Avg. | 200-Day Moving Avg. | RSI (14-Day) |
| AXP - American Express Co | 308.90 | 359.54 | 334.67 | 28% |
| BAC - Bank Of America Corp | 49.83 | 53.96 | 50.38 | 24% |
| IBM - International Business Machines Corp | 240.21 | 287.99 | 279.97 | 23% |
| USB - US Bancorp | 54.66 | 56.06 | 49.18 | 29% |
| WFC - Wells Fargo & Company | 81.45 | 90.84 | 83.75 | 25% |
Note: RSI = Wilder's Relative Strength Index. Oversold = (RSI < 30).
Overbought Stocks as of 02/27/2026
| Ticker - Company | Closing Price | 50-Day Moving Avg. | 200-Day Moving Avg. | RSI (14-Day) |
| DUK - Duke Energy Corp | 130.85 | 120.78 | 120.82 | 80% |
| EXC - Exelon Corporation | 49.47 | 44.92 | 44.61 | 79% |
| KMI - Kinder Morgan Inc | 33.27 | 29.32 | 27.87 | 93% |
| LIN - Linde plc | 508.08 | 452.89 | 454.93 | 88% |
| PYPL - PayPal Holdings Inc | 46.21 | 52.08 | 64.98 | 70% |
| SO - Southern Company | 97.38 | 89.49 | 91.41 | 70% |
| VZ - Verizon Communications | 50.14 | 43.19 | 42.52 | 72% |
Notes:
Note: RSI = Wilder's Relative Strength Index. Overbought = (RSI > 70).